| Date | May 2014 | Marks available | 1 | Reference code | 14M.2.sl.TZ1.8 |
| Level | SL only | Paper | 2 | Time zone | TZ1 |
| Command term | Write down | Question number | 8 | Adapted from | N/A |
Question
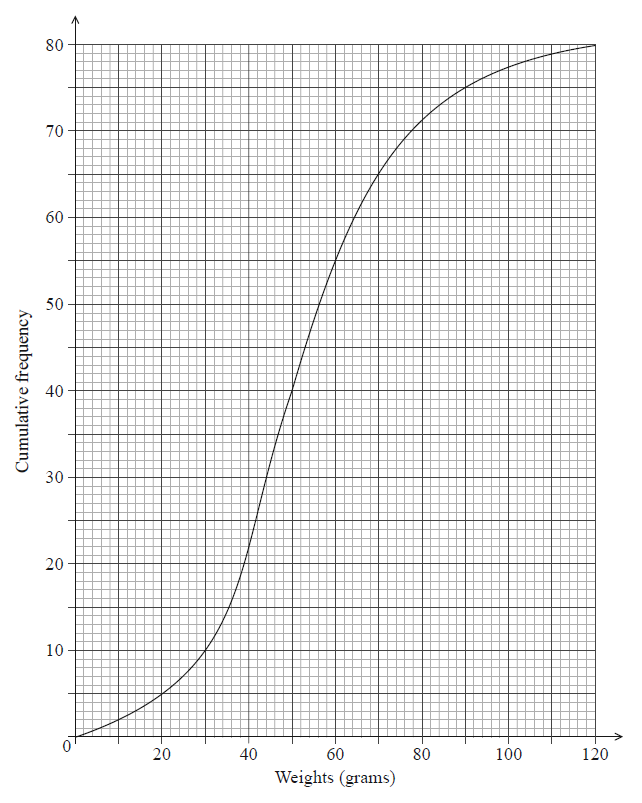
The weights in grams of 80 rats are shown in the following cumulative frequency diagram.
Do NOT write solutions on this page.
Write down the median weight of the rats.
Find the percentage of rats that weigh 70 grams or less.
The same data is presented in the following table.
| Weights \(w\) grams |
\(0 \leqslant w \leqslant 30\) | \(30 < w \leqslant 60\) | \(60 < w \leqslant 90\) | \(90 < w \leqslant 120\) |
| Frequency | \(p\) | \(45\) | \(q\) | \(5\) |
Write down the value of \(p\).
The same data is presented in the following table.
| Weights \(w\) grams |
\(0 \leqslant w \leqslant 30\) | \(30 < w \leqslant 60\) | \(60 < w \leqslant 90\) | \(90 < w \leqslant 120\) |
| Frequency | \(p\) | \(45\) | \(q\) | \(5\) |
Find the value of \(q\).
The same data is presented in the following table.
| Weights \(w\) grams |
\(0 \leqslant w \leqslant 30\) | \(30 < w \leqslant 60\) | \(60 < w \leqslant 90\) | \(90 < w \leqslant 120\) |
| Frequency | \(p\) | \(45\) | \(q\) | \(5\) |
Use the values from the table to estimate the mean and standard deviation of the weights.
Assume that the weights of these rats are normally distributed with the mean and standard deviation estimated in part (c).
Find the percentage of rats that weigh 70 grams or less.
Assume that the weights of these rats are normally distributed with the mean and standard deviation estimated in part (c).
A sample of five rats is chosen at random. Find the probability that at most three rats weigh 70 grams or less.
Markscheme
50 (g) A1 N1
[2 marks]
65 rats weigh less than 70 grams (A1)
attempt to find a percentage (M1)
eg \(\frac{{65}}{{80}},{\text{ }}\frac{{65}}{{80}} \times 100\)
81.25 (%) (exact), 81.3 A1 N3
[2 marks]
\(p = 10\) A2 N2
[2 marks]
subtracting to find \(q\) (M1)
eg \(75 - 45 - 10\)
\(q = 20\) A1 N2
[2 marks]
evidence of mid-interval values (M1)
eg \(15, 45, 75, 105\)
\(\overline x = 52.5\) (exact), \(\sigma = 22.5\) (exact) A1A1 N3
[3 marks]
0.781650
78.2 (%) A2 N2
[2 marks]
recognize binomial probability (M1)
eg \(X \sim {\text{B}}(n,{\text{ }}p)\), \(\left( \begin{array}{c}5\\r\end{array} \right)\) \( \times {0.782^r} \times {0.218^{5 - r}}\)
valid approach (M1)
eg \({\text{P}}(X \leqslant 3)\)
\(0.30067\)
\(0.301\) A1 N2
[3 marks]