| Date | May 2012 | Marks available | 5 | Reference code | 12M.1.sl.TZ1.1 |
| Level | SL only | Paper | 1 | Time zone | TZ1 |
| Command term | Estimate | Question number | 1 | Adapted from | N/A |
Question
The ages of people attending a music concert are given in the table below.
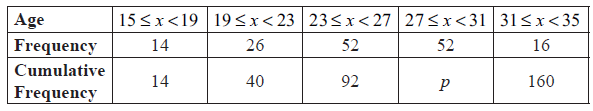
Find p .
The cumulative frequency diagram is given below.
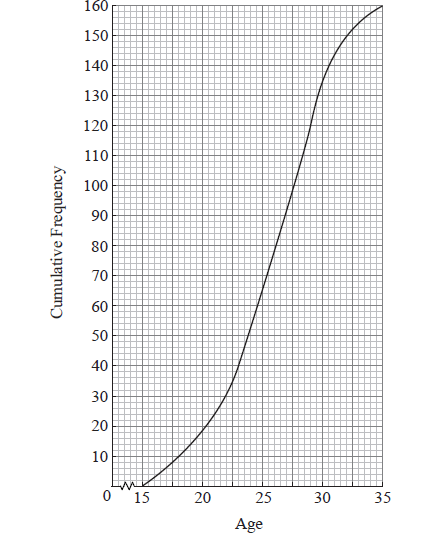
Use the diagram to estimate
(i) the 80th percentile;
(ii) the interquartile range.
Markscheme
evidence of valid approach (M1)
e.g. \(92 + 52\) , line on graph at \(x = 31\)
\(p = 144\) A1 N2
[2 marks]
(i) evidence of valid approach (M1)
e.g. line on graph, \(0.8 \times 160\) , using complement
\( = 29.5\) A1 N2
(ii) \({Q_1} = 23\) ; \({Q_3} = 29\) (A1)(A1)
\({\text{IQR}} = 6\) (accept any notation that suggests an interval) A1 N3
[5 marks]
Examiners report
Part (a) was generally answered correctly, with most candidates showing a good grasp of cumulative frequency from a table.
A surprising number of candidates had difficulty reading values off the cumulative frequency curve. A common incorrect answer for (b)(i) was 29, indicating carelessness with the given scale. Too many candidates gave 40 and 120 for the quartile values.