| Date | May 2012 | Marks available | 3 | Reference code | 12M.1.sl.TZ2.1 |
| Level | SL only | Paper | 1 | Time zone | TZ2 |
| Command term | Find | Question number | 1 | Adapted from | N/A |
Question
The cumulative frequency curve below represents the marks obtained by 100 students.
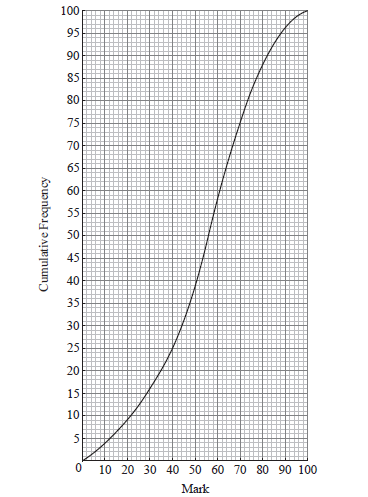
Find the median mark.
Find the interquartile range.
Markscheme
evidence of median position (M1)
e.g. 50, line on sketch
median is 56 A1 N2
[2 marks]
lower quartile \(= 40\) , upper quartile \(= 70\) (A1)(A1)
interquartile range \(= 30\) A1 N3
[3 marks]
Examiners report
Overall, this question was done well by candidates. In part (a), a surprising number of candidates found the median position (the cumulative frequency) on the y-axis, but did not find the median mark on the x-axis.
Overall, this question was done well by candidates. In part (a), a surprising number of candidates found the median position (the cumulative frequency) on the y-axis, but did not find the median mark on the x-axis. Similar misunderstanding was shown by some candidates in part (b), when attempting to find the interquartile range.