| Date | May 2011 | Marks available | 2 | Reference code | 11M.1.sl.TZ2.6 |
| Level | SL only | Paper | 1 | Time zone | TZ2 |
| Command term | Question number | 6 | Adapted from | N/A |
Question
A scientist has 100 female fish and 100 male fish. She measures their lengths to the nearest cm. These are shown in the following box and whisker diagrams.
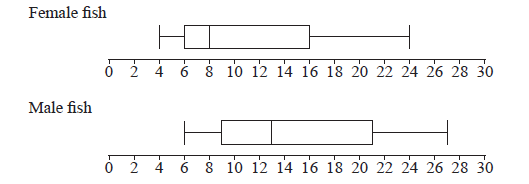
Find the range of the lengths of all 200 fish.
Four cumulative frequency graphs are shown below.
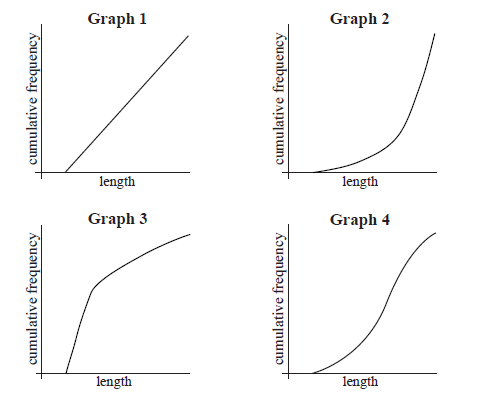
Which graph is the best representation of the lengths of the female fish?
Markscheme
correct end points (A1)(A1)
max = 27 , min = 4
range = 23 A1 N3
[3 marks]
Graph 3 A2 N2
[2 marks]
Examiners report
While there were a large number of candidates who answered both parts of this question correctly, a surprising number did not know how to find the range of all 200 fish in part (a). Common errors included finding the ranges of the male and female fish separately, or averaging the separate ranges of the male and female fish.
Some candidates did not interpret the cumulative frequency graphs correctly, or just seemed to guess which graph was correct. The most common incorrect "guess" was graph 4, likely because this graph had a more familiar cumulative shape.