| Date | November 2013 | Marks available | 2 | Reference code | 13N.1.sl.TZ0.3 |
| Level | SL only | Paper | 1 | Time zone | TZ0 |
| Command term | Find | Question number | 3 | Adapted from | N/A |
Question
The following is a cumulative frequency diagram for the time t, in minutes, taken by 80 students to complete a task.
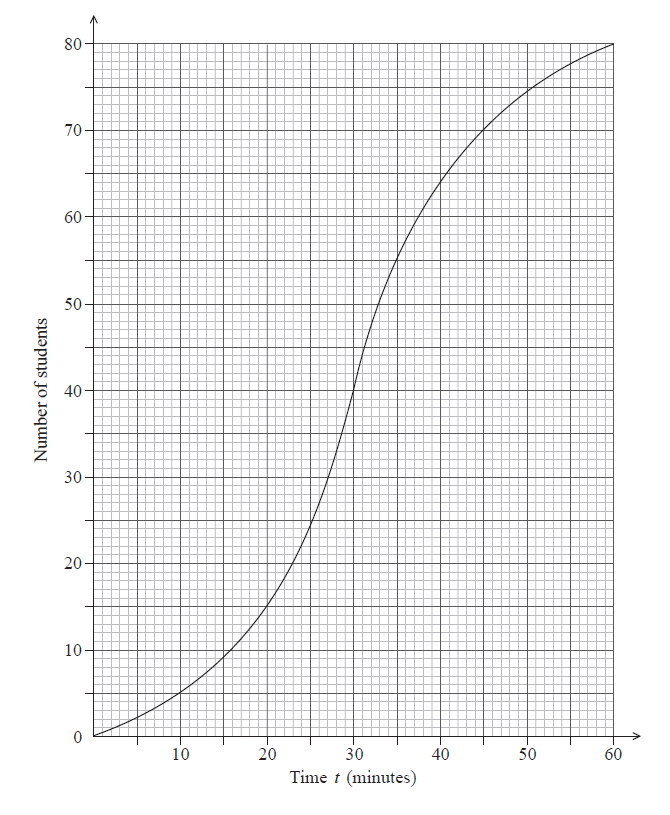
Find the number of students who completed the task in less than 45 minutes.
Find the number of students who took between 35 and 45 minutes to complete the task.
Given that 50 students take less than k minutes to complete the task, find the value of \(k\).
Markscheme
attempt to find number who took less than 45 minutes (M1)
eg line on graph (vertical at approx 45, or horizontal at approx 70)
70 students (accept 69) A1 N2
[2 marks]
55 students completed task in less than 35 minutes (A1)
subtracting their values (M1)
eg 70 – 55
15 students A1 N2
[3 marks]
correct approach (A1)
eg line from y-axis on 50
\(k = 33\) A1 N2
[2 marks]