| Date | November 2017 | Marks available | 3 | Reference code | 17N.1.sl.TZ0.3 |
| Level | SL only | Paper | 1 | Time zone | TZ0 |
| Command term | Sketch | Question number | 3 | Adapted from | N/A |
Question
The following diagram shows the graph of a function \(f\), with domain \( - 2 \leqslant x \leqslant 4\).
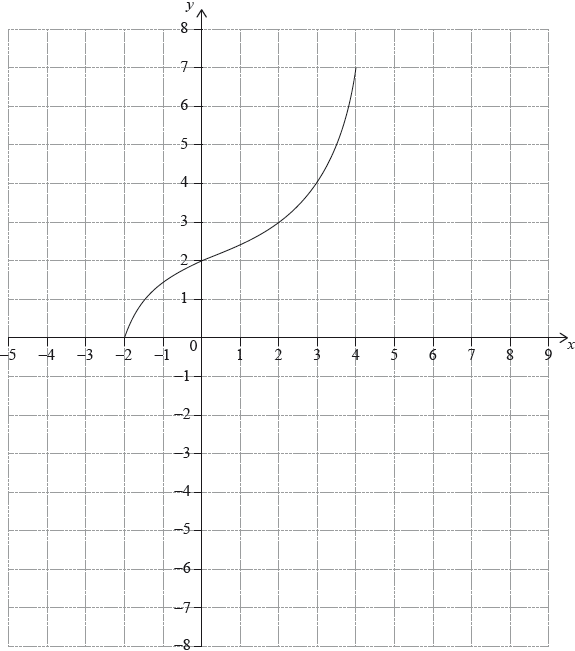
The points \(( - 2,{\text{ }}0)\) and \((4,{\text{ }}7)\) lie on the graph of \(f\).
Write down the range of \(f\).
Write down \(f(2)\);
Write down \({f^{ - 1}}(2)\).
On the grid, sketch the graph of \({f^{ - 1}}\).
Markscheme
correct range (do not accept \(0 \leqslant x \leqslant 7\)) A1 N1
eg\(\,\,\,\,\,\)\([0,{\text{ }}7],{\text{ }}0 \leqslant y \leqslant 7\)
[1 mark]
\(f(2) = 3\) A1 N1
[1 mark]
\({f^{ - 1}}(2) = 0\) A1 N1
[1 mark]
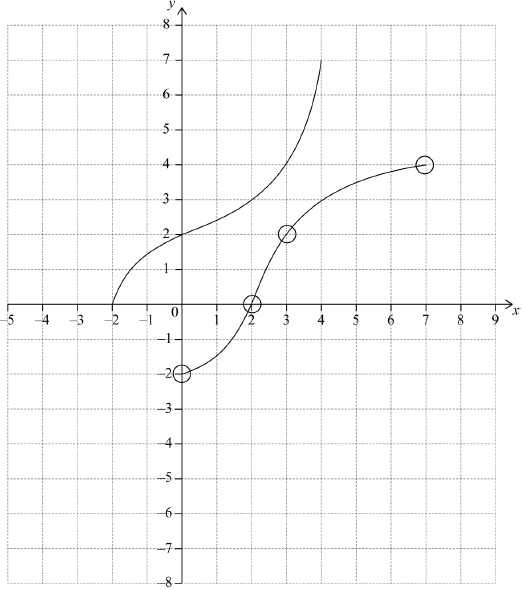 A1A1A1 N3
Notes: Award A1 for both end points within circles,
A1 for images of \((2,{\text{ }}3)\) and \((0,{\text{ }}2)\) within circles,
A1 for approximately correct reflection in \(y = x\), concave up then concave down shape (do not accept line segments).
[3 marks]