| Date | November 2016 | Marks available | 3 | Reference code | 16N.2.SL.TZ0.S_10 |
| Level | Standard Level | Paper | Paper 2 | Time zone | Time zone 0 |
| Command term | Write down and Find | Question number | S_10 | Adapted from | N/A |
Question
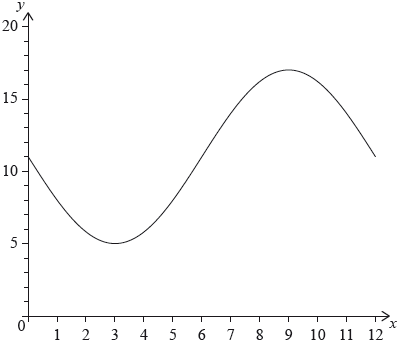
The following diagram shows the graph of , for .

The graph of has a minimum point at and a maximum point at .
The graph of is obtained from the graph of by a translation of . The maximum point on the graph of has coordinates .
The graph of changes from concave-up to concave-down when .
(i) Find the value of .
(ii) Show that .
(iii) Find the value of .
(i) Write down the value of .
(ii) Find .
(i) Find .
(ii) Hence or otherwise, find the maximum positive rate of change of .
Markscheme
* This question is from an exam for a previous syllabus, and may contain minor differences in marking or structure.
(i) valid approach (M1)
eg
A1 N2
(ii) valid approach (M1)
egperiod is 12, per
A1
AG N0
(iii) METHOD 1
valid approach (M1)
eg, substitution of points
A1 N2
METHOD 2
valid approach (M1)
eg, amplitude is 6
A1 N2
[6 marks]
(i) A1 N1
(ii) A2 N2
[3 marks]
(i) METHOD 1 Using
recognizing that a point of inflexion is required M1
egsketch, recognizing change in concavity
evidence of valid approach (M1)
eg, sketch, coordinates of max/min on
(exact) A1 N2
METHOD 2 Using
recognizing that a point of inflexion is required M1
egsketch, recognizing change in concavity
evidence of valid approach involving translation (M1)
eg, sketch,
(exact) A1 N2
(ii) valid approach involving the derivative of or (seen anywhere) (M1)
eg, max on derivative, sketch of derivative
attempt to find max value on derivative M1
eg, dot on max of sketch
3.14159
max rate of change (exact), 3.14 A1 N2
[6 marks]

