| Date | May 2013 | Marks available | 1 | Reference code | 13M.1.hl.TZ1.21 |
| Level | HL | Paper | 1 | Time zone | TZ1 |
| Command term | Identify | Question number | 21 | Adapted from | N/A |
Question
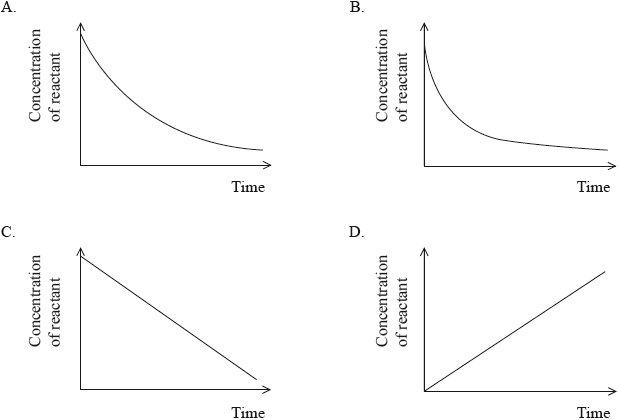
Which graph best represents a second-order reaction?
Markscheme
B
Examiners report
One respondent stated that graphs A and B look too similar so students might not be able to clearly see that the answer is B. The initial gradient of curve B is clearly greater so candidates should have recognized the faster decrease in initial concentration for a second order reaction. Curve A clearly shows a constant half-life so candidates should have recognized that it refers to a first order reaction. 60.65% of the candidates chose the correct answer B.
Syllabus sections
Additional higher level (AHL) » Topic 16: Chemical kinetics » 16.1 Rate expression and reaction mechanism
Show 82 related questions
- 17N.2.hl.TZ0.2e.iii: Calculate the value of the rate constant at 263 K.
- 17N.2.hl.TZ0.2e.ii: State the rate expression for the reaction.
- 17N.2.hl.TZ0.2e.i: Deduce the order of reaction with respect to Cl2 and NO.
- 17N.1.hl.TZ0.22: Which pair of statements explains the increase in rate of reaction when the temperature...
- 17N.1.hl.TZ0.21: The rate expression for the reaction X (g) + 2Y (g) → 3Z (g) is rate = k[X]0 [Y]2 By which...
- 17M.2.hl.TZ2.5b.v: Sketch the relationship between the rate of reaction and the concentration of NO2.
- 17M.2.hl.TZ2.5b.iii: State one method that can be used to measure the rate for this reaction.
- 17M.2.hl.TZ2.5b.ii: The following mechanism is proposed for the...
- 17M.2.hl.TZ2.5b.i: State the rate expression for the reaction.
- 17M.1.hl.TZ2.21: Which is correct about reaction mechanisms? A. A species that is zero order does not...
- 17M.1.hl.TZ2.12: Which is the first step in the CFC-catalysed destruction of ozone in UV light? A. CCl2F2...
- 17M.2.hl.TZ1.1d: When the reaction is carried out in the absence of acid the following graph is...
- 17M.2.hl.TZ1.1c: When the concentration of iodine is varied, while keeping the concentrations of acid and...
- 17M.2.hl.TZ1.1b: The student then carried out the experiment at other acid concentrations with all...
- 17M.1.hl.TZ1.21: What are the units for the rate constant, k, in the expression? Rate = k [X]2[Y] A. ...
- 17M.1.hl.TZ1.20: The table gives rate data for the reaction in a suitable solvent. C4H9Br + OH− → C4H9OH +...
- 16N.2.hl.TZ0.3e: (i) Using the graph, explain the order of reaction with respect to sodium thiosulfate. (ii)...
- 16N.1.hl.TZ0.22: Decomposition of hydrogen peroxide in an aqueous solution proceeds as follows. 2H2O2(aq) →...
- 16N.1.hl.TZ0.21: Which statement describes the characteristics of a transition state relative to the potential...
- 16M.2.hl.TZ0.3a: (i) State the equation for the overall reaction. (ii) Deduce the rate expression consistent...
- 16M.1.hl.TZ0.22: Which pair of graphs...
- 16M.1.hl.TZ0.21: The data shows the effect of...
- 15M.1.hl.TZ1.20: Which statement about a first-order reaction is correct? A. The reactant concentration...
- 15M.1.hl.TZ1.21: Consider the rate expression: \[{\text{Rate}} = k{\text{[X][Y]}}\] Which change decreases...
- 15M.1.hl.TZ2.21: The hydrolysis of tertiary bromoalkanes with a warm dilute aqueous sodium hydroxide solution...
- 15M.1.hl.TZ2.20: What are the units of the rate constant for a zero-order reaction? A. s B. ...
- 15M.2.hl.TZ1.7c.i: Determine the orders of reaction of the reactants and the overall rate expression for the...
- 15M.2.hl.TZ1.7c.ii: Determine the rate constant, \(k\), with its units, using the data from experiment 3.
- 15M.2.hl.TZ1.7c.iii: Identify the molecularity of the rate-determining step in this reaction.
- 15M.2.hl.TZ2.2c.i: Identify the rate-determining step.
- 15M.2.hl.TZ2.2c.ii: A student hypothesized that the order of reaction with respect to \({{\text{H}}_{\text{2}}}\)...
- 14M.1.hl.TZ1.20: X and Y react according to the equation \({\text{2X}} + {\text{Y}} \to {\text{Z}}\). The...
- 14M.1.hl.TZ2.21: Which combination shows a second-order rate expression with the correct rate constant units?
- 14M.2.hl.TZ1.2b: State the rate expression for this reaction.
- 14M.2.hl.TZ1.2c: Determine the value of the rate constant, \(k\), and state its units.
- 14M.2.hl.TZ1.2d: State an equation for a possible rate-determining step for the reaction.
- 14M.2.hl.TZ2.6a: (i) State the volumes of the liquids that should be mixed. (ii) State why it is...
- 14M.2.hl.TZ2.6b: (i) Deduce the rate expression of this mechanism. (ii) The results of an...
- 14N.1.hl.TZ0.20: Consider the following reaction between nitrogen monoxide and...
- 14N.2.hl.TZ0.11c: (i) In some reactions, increasing the concentration of a reactant does not increase the...
- 14N.2.hl.TZ0.11d: Sketch a graph of rate constant \((k)\) versus temperature.
- 13N.1.hl.TZ0.22: Consider the following proposed two-step reaction mechanism at temperature T. Step 1: ...
- 13N.1.hl.TZ0.21: The following experimental rate data were obtained for a reaction carried out at temperature...
- 13N.2.hl.TZ0.8e.ii: State the rate expression for this reaction and the units of the rate constant.
- 13M.1.hl.TZ1.20: For the gas phase reaction: \[{\text{A(g)}} + {\text{B(g)}} \to {\text{C(g)}}\] the...
- 13M.2.hl.TZ1.9c.i: Deduce the order of reaction with respect to...
- 13M.2.hl.TZ1.9c.ii: Deduce the rate expression.
- 13M.2.hl.TZ1.9c.iii: Based on the rate expression obtained in (c) (ii) state the units of the rate constant, \(k\).
- 13M.1.hl.TZ2.20: Experimental data shows that a reaction in which Y is a reactant is first order with respect...
- 13M.1.hl.TZ2.21: Which statement about a reaction best describes the relationship between the temperature,...
- 13M.1.hl.TZ2.22: Carbon monoxide and nitrogen dioxide react to form carbon dioxide and nitrogen monoxide...
- 13M.2.hl.TZ2.2b: State how the rate constant, k , varies with temperature, T.
- 13M.2.hl.TZ2.2c: Determine the activation energy, \({E_{\text{a}}}\), correct to three significant figures and...
- 12N.2.hl.TZ0.6d: (i) Deduce the rate expression. (ii) Determine the rate constant, \(k\), and state...
- 12N.2.hl.TZ0.6c: (i) Concentration of reactant X against time for a zero-order reaction. (ii) Rate...
- 10N.1.hl.TZ0.20: Consider the following reaction. \[{\text{2P}} + {\text{Q}} \to {\text{R}} +...
- 10N.2.hl.TZ0.5g: (i) Deduce the rate expression for the reaction. (ii) Determine the value of the...
- 09N.2.hl.TZ0.6a.i: State the rate expression for the forward reaction.
- 09N.2.hl.TZ0.6b: Consider the following...
- 10M.2.hl.TZ1.2b: (i) Deduce the order of reaction for each substance and the rate expression from the...
- 10M.2.hl.TZ1.2c: Using the data from Experiment 1, determine the concentration of the substances used and the...
- 10M.1.hl.TZ2.21: The following data were obtained for the reaction between gases A and B. Which...
- 09M.1.hl.TZ2.21: Consider the following...
- 09M.1.hl.TZ2.22: The rate expression for a reaction is: \[{\text{rate}} = k{\text{[X][Y]}}\] Which statement...
- 09M.1.hl.TZ2.23: Consider the following reaction...
- 09M.2.hl.TZ2.7c.i: Identify the rate-determining step.
- 09M.2.hl.TZ2.7c.ii: Identify the intermediate involved in the reaction.
- 09M.2.hl.TZ2.7b.i: The kinetics of the reaction were studied at this temperature. The table shows the initial...
- 09M.2.hl.TZ2.7b.iii: Determine the value of the rate constant for the reaction from Experiment 3 and state its units.
- 09M.2.hl.TZ2.7b.ii: Deduce the rate expression for the reaction.
- 11M.1.hl.TZ1.23: Which step is the rate-determining step of a reaction? A. The step with the lowest...
- 11M.1.hl.TZ1.21: Bromine and nitrogen(II) oxide react according to the following...
- 11M.2.hl.TZ1.2c: The rate expression for this reaction is rate...
- 11M.1.hl.TZ2.22: Consider the following...
- 11M.1.hl.TZ2.21: The rate information below was obtained for the following reaction at a constant...
- 11M.2.hl.TZ2.3b.ii: Deduce the units for the rate constant \(k\).
- 12M.1.hl.TZ2.19: Which graph represents a reaction that is second order with respect to X for the reaction X...
- 11N.1.hl.TZ0.22: Which graph represents a reaction that is first order with respect to reactant A.
- 11N.2.hl.TZ0.8f.i: Identify the intermediate in the reaction.
- 11N.2.hl.TZ0.8e.ii: The table below shows initial rates of reaction for different concentrations of each reactant...
- 11N.2.hl.TZ0.8f.ii: The observed rate expression is...
- 11N.2.hl.TZ0.8g: The following two-step mechanism has been suggested for the reaction of...