| Date | May 2012 | Marks available | 1 | Reference code | 12M.1.hl.TZ2.19 |
| Level | HL | Paper | 1 | Time zone | TZ2 |
| Command term | Question number | 19 | Adapted from | N/A |
Question
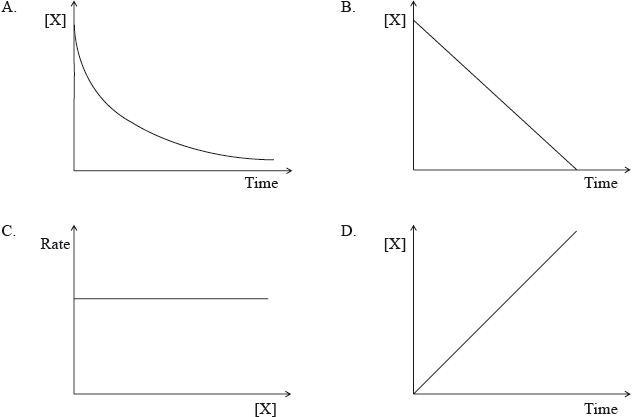
Which graph represents a reaction that is second order with respect to X for the reaction X \( \to \) products?
Markscheme
A
Examiners report
One respondent stated that the graph in A looks more like a first order reaction than a second order reaction. In this question, C is ruled out as the rate-concentration plot would represent a clear zero-order reaction. B is also ruled out as a zero-order reaction will involve a straight line. D is also a straight line. Hence, by a process of elimination A must be the answer, as a second-order reaction will involve a curve for a concentration-time plot. It is true to say that a first-order reaction will also involve a curve for a concentration-time plot. In fact a first-order concentration-time curve is an exponential curve and a second-order concentration-time curve is a quadratic curve, which appears somewhat to have greater depth if the two are compared. It can be difficult to distinguish the two plots in fact based on experimental data, but this was not an issue for this question as second order was clearly mentioned in the question and B, C and D could be eliminated also. The question in fact was the fourth easiest question on the paper for candidates, with 86.42% of candidates getting the correct answer A.