| Date | May 2014 | Marks available | 1 | Reference code | 14M.1.sl.TZ1.8 |
| Level | SL | Paper | 1 | Time zone | TZ1 |
| Command term | Question number | 8 | Adapted from | N/A |
Question
The horizontal axis of the bar chart represents the elements of period 3 from sodium to chlorine (excluding silicon). What could the vertical axis represent?
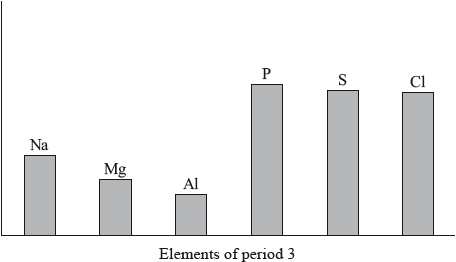
A. Melting point of the element
B. Electronegativity of the bonded atom
C. Ionic radius of the most common ion
D. First ionization energy in the gaseous state
Markscheme
C
Examiners report
[N/A]
Syllabus sections
Show 143 related questions
- 17N.2.sl.TZ0.2c: State an equation for the reaction of phosphorus (V) oxide, P4O10 (s), with water.
- 17N.2.sl.TZ0.2b: Explain why the melting points of the group 1 metals (Li → Cs) decrease down the group.
- 17N.2.sl.TZ0.2a: Explain the general increasing trend in the first ionization energies of the period...
- 17N.1.sl.TZ0.8: Which oxide dissolves in water to give a solution with a pH below 7? A. MgO B. Li2O C....
- 17N.1.sl.TZ0.7: Which trends are correct across period 3 (from Na to Cl)? I. Atomic radius decreasesII. ...
- 17N.2.hl.TZ0.3b: Explain why the melting points of the group 1 metals (Li → Cs) decrease down the group...
- 17M.2.sl.TZ2.1c.i: Some oxides of period 3, such as Na2O and P4O10, react with water. A spatula measure of each...
- 17M.1.hl.TZ2.5: X, Y and Z represent the successive elements, Ne, Na and Mg, but not necessarily in that...
- 17M.1.sl.TZ2.12: Which metal has the strongest metallic bond? A. Li B. Na C. K D. Rb
- 17M.2.hl.TZ1.2d.ii: Suggest why the melting point of vanadium is higher than that of titanium.
- 17M.2.sl.TZ1.2d.ii: Explain why an aluminium-titanium alloy is harder than pure aluminium.
- 17M.1.hl.TZ1.6: What is the order of decreasing ionic radius? A. S2− > Cl− > Al3+ > Mg2+ B. ...
- 17M.1.sl.TZ1.8: Which oxide, when added to water, produces the solution with the highest pH? A. Na2O B....
- 16N.2.sl.TZ0.4e: In addition to magnesium oxide, magnesium forms another compound when burned in air. Suggest...
- 16N.2.sl.TZ0.4d: Describe the trend in acid-base properties of the oxides of period 3, sodium to chlorine.
- 16N.1.hl.TZ0.8: Which correctly describes the reaction between potassium and excess water? A. The reaction...
- 16N.1.hl.TZ0.7: Which property increases down group 17, the halogens? A. Electron affinity B. Boiling...
- 16N.1.sl.TZ0.8: Which solution forms when phosphorus(V) oxide, P4O10, reacts with water?
- 16N.1.sl.TZ0.7: Which equation represents the first electron affinity of chlorine? A. Cl(g)+e-→ Cl-(g)B....
- 16M.2.hl.TZ0.1d: Impurities cause phosphine to ignite spontaneously in air to form an oxide of phosphorus and...
- 16M.2.sl.TZ0.2b: (i) State the equation for the reaction of this oxide of phosphorus with water. (ii) Predict...
- 16M.1.sl.TZ0.8: Which periodic trend is described correctly?
- 16M.1.sl.TZ0.7: Which element is a metalloid? A. Co B. As C. Cs D. Es
- 15M.1.hl.TZ2.7: What is the definition of electronegativity? A. The relative measure of the tendency of...
- 15M.2.hl.TZ1.2a: State the equations for the reactions of sodium oxide with water and phosphorus(V) oxide with...
- 15M.2.hl.TZ2.9a.ii: Suggest, giving your reasons, the approximate pH values of the solutions formed by adding...
- 15M.2.hl.TZ2.9b.i: Identify the acid-base character of the oxides of each of the elements from sodium to...
- 15M.2.hl.TZ2.9b.ii: State the equations for the separate reactions of sodium oxide and phosphorus(V) oxide with...
- 15M.1.sl.TZ2.7: Which statement is correct for the halogens \({\text{(F}} \to {\text{I)}}\)? A. ...
- 15M.1.sl.TZ2.8: Which combination of properties best describes sodium oxide,...
- 15M.2.sl.TZ1.6a: Define the term electronegativity.
- 15M.2.sl.TZ1.6b: Explain why the atomic radius of elements decreases across the period.
- 15M.2.sl.TZ1.6c.i: State the equations for the reactions of sodium oxide with water and phosphorus(V) oxide with...
- 15M.2.sl.TZ2.6b.i: State the equation for the reaction between potassium and chlorine.
- 15M.2.sl.TZ2.6c.i: Identify the acid-base character of the oxides of each of the elements from sodium to...
- 15M.2.sl.TZ2.6c.ii: State the equations for the separate reactions of sodium oxide and phosphorus(V) oxide with...
- 14M.1.hl.TZ1.7: Which statements about reactivity are correct? I. Potassium reacts more vigorously than...
- 14M.2.hl.TZ1.5a: (i) State the changes in the acid-base nature of the oxides across period 3 (from...
- 14M.2.hl.TZ1.6b: (i) Deduce the order of reactivity of these four metals, from the least to the most...
- 14M.2.hl.TZ2.5a: (i) Describe the colour change that occurs when aqueous chlorine is added to aqueous...
- 14M.2.hl.TZ1.5b: (i) Predict any changes that may be observed in each...
- 14M.2.hl.TZ2.8a: Define the term first ionization energy.
- 15M.1.sl.TZ1.8: What is the definition of the term first ionization energy? A. The energy released when...
- 14M.1.sl.TZ1.9: The electronegativities of four elements are given in the table. Which statement is...
- 14M.2.sl.TZ1.5a: (i) State the equation for the reaction of sodium metal with water. (ii) Describe...
- 14M.2.sl.TZ1.5e.i: \({\text{N}}{{\text{a}}_{\text{2}}}{\text{O}}\) does not conduct electricity in the solid...
- 14M.2.sl.TZ1.5e.iii: State equations for the reactions of \({\text{N}}{{\text{a}}_{\text{2}}}{\text{O}}\) and...
- 14M.1.sl.TZ2.7: Which properties decrease down group 1? I. Melting point II. Atomic radius III. ...
- 14M.2.sl.TZ1.5d: Explain why the ionic radius of a chloride ion is greater than the atomic radius of a...
- 14M.2.sl.TZ1.6d: (i) Deduce the order of reactivity of these four metals, from the least to the most...
- 14M.1.sl.TZ2.8: Which pair of elements shows the greatest difference in electronegativity? A. Mg and...
- 14M.2.sl.TZ1.5b: (i) Predict any changes that may be observed in each...
- 14M.2.sl.TZ1.5e.ii: State the acid-base natures of \({\text{N}}{{\text{a}}_{\text{2}}}{\text{O}}\) and...
- 14M.2.sl.TZ2.4a: (i) Describe the colour change that occurs when aqueous chlorine is added to aqueous...
- 14M.2.sl.TZ2.4b: The colour change in the reaction between aqueous chlorine and aqueous sodium iodide is very...
- 14N.1.hl.TZ0.6: Which statements are correct for the oxides of period 3 going from Na to Cl? I. The...
- 14N.1.hl.TZ0.7: The elements argon, potassium, and calcium are consecutive in the periodic table. Which gives...
- 14N.2.hl.TZ0.8c: (i) Magnesium reacts with oxygen to form an ionic compound, magnesium oxide. Describe how...
- 14N.1.sl.TZ0.7: Which properties decrease down both group 1 and group 7? I. Melting point II. First...
- 14N.1.sl.TZ0.8: Which period 3 oxide, when added to water, forms an acidic solution? A. ...
- 14N.2.sl.TZ0.6c: State an equation for the reaction of magnesium oxide with water.
- 13N.1.hl.TZ0.6: Which series is arranged in order of increasing radius? A. ...
- 13N.1.hl.TZ0.7: Which oxides form acidic solutions when added to water? A. ...
- 13N.2.hl.TZ0.6e.i: Compare the properties of the three oxides by completing the table below.
- 13N.2.hl.TZ0.7a: State the element that you would expect to have chemical properties most similar to those of...
- 13N.1.sl.TZ0.9: Which series is arranged in order of increasing radius? A. ...
- 13M.1.hl.TZ1.8: Each of the following oxides is added to separate equal volumes of distilled water. Which of...
- 13M.1.hl.TZ1.15: Which process is endothermic? A. ...
- 13M.2.hl.TZ1.7a.ii: Deduce, using equations where appropriate, if bromine reacts with sodium chloride solution...
- 13M.2.hl.TZ1.2a: Describe and explain the trend in atomic radius across period 3.
- 13M.2.hl.TZ1.2b: A student formulates the following hypothesis: “If phosphorus were to form a positive ion,...
- 13M.2.hl.TZ1.7a.i: Explain the trend in reactivity of the halogens.
- 13M.1.sl.TZ1.21: Which is a characteristic property of sodium oxide? A. It turns moist blue litmus paper...
- 13M.1.sl.TZ1.8: Which statement concerning electronegativity is correct? A. Electronegativity increases...
- 13M.1.sl.TZ1.9: Which statements are correct? I. Fluorine will react with potassium chloride solution to...
- 13M.2.sl.TZ1.2a: Describe and explain the trend in atomic radius across period 3.
- 13M.2.sl.TZ1.2b: A student formulates the following hypothesis: “If phosphorus were to form a positive ion,...
- 13M.1.hl.TZ2.7: Which statements are correct for the alkali metals Li to Cs? I. Melting point...
- 13M.1.sl.TZ2.9: Which statements are correct for the halogens F to I? I. Melting point increases II. ...
- 13M.2.sl.TZ2.6b.i: Define the term electronegativity.
- 13M.2.sl.TZ2.6b.ii: Using Table 7 of the Data Booklet, explain the trends in electronegativity values of the...
- 13M.2.sl.TZ2.6b.iii: State the balanced chemical equation for the reaction of potassium bromide, KBr(aq), with...
- 13M.2.sl.TZ2.6b.iv: Describe the colour change likely to be observed in this reaction.
- 12N.1.sl.TZ0.9: Which oxides are acidic? I. \({{\text{P}}_{\text{4}}}{{\text{O}}_{{\text{10}}}}\) II. ...
- 12N.1.sl.TZ0.8: Which combination is correct for the properties of the alkali metals from Li to Cs?
- 10N.1.hl.TZ0.7: The x-axis of the graph below represents the atomic number of the elements in period...
- 10N.2.hl.TZ0.4d: (i) State whether aqueous solutions of magnesium oxide and magnesium chloride are acidic,...
- 10N.1.sl.TZ0.8: Which properties of the alkali metals decrease going down group 1? A. First ionization...
- 10N.1.sl.TZ0.9: Which statements about the periodic table are correct? I. The elements Mg, Ca and Sr...
- 10N.1.sl.TZ0.10: The electronegativities of four different elements are given below (the letters are not their...
- 10N.2.sl.TZ0.4b: (i) Define the term electronegativity. (ii) Compare the relative polarities of the...
- 09N.1.hl.TZ0.8: Which species has the largest radius? A. Cl– B. K C. Na+ D. K+
- 09N.2.hl.TZ0.7a.v: The inter-ionic distance between the ions in NaF is very similar to that between the ions in...
- 09N.1.sl.TZ0.8: What happens when sodium is added to water? I. A gas is evolved II. The temperature...
- 10M.2.sl.TZ1.4e: State a balanced equation for the reaction of sodium with water. Include state symbols.
- 10M.2.sl.TZ1.4f: With reference to electronic arrangements, suggest why the reaction between rubidium and...
- 10M.2.sl.TZ1.4g: Describe and explain what you will see if chlorine gas is bubbled through a solution of (i) ...
- 10M.2.hl.TZ2.6c: (i) Outline two reasons why a sodium ion has a smaller radius than a sodium atom. (ii) ...
- 10M.1.sl.TZ2.8: Which property decreases down group 7 in the periodic table? A. Melting point B. ...
- 10M.1.sl.TZ2.9: Which oxides produce an acidic solution when added to water? I. ...
- 10M.2.sl.TZ2.5a: (i) Identify the property used to arrange the elements in the periodic table. (ii) ...
- 10M.2.sl.TZ2.3a: Explain the increase in the melting point from sodium to aluminium.
- 10M.2.sl.TZ2.3b: Explain why sulfur, \({{\text{S}}_{\text{8}}}\), has a higher melting point than phosphorus,...
- 10M.2.sl.TZ2.3c: Explain why silicon has the highest melting point and argon has the lowest melting point.
- 10M.2.sl.TZ2.5b: (i) Define the term first ionization energy of an atom. (ii) Explain the general...
- 09M.2.hl.TZ1.6b.iv: Explain why the quantitative value for the lattice enthalpy of calcium bromide is larger than...
- 09M.2.hl.TZ1.8b.ii: Explain how information from this graph provides evidence for the existence of main energy...
- 09M.2.hl.TZ1.8b.iv: Sketch and explain the shape of the graph obtained for the successive ionization energies of...
- 09M.1.sl.TZ1.10: Which is the best definition of electronegativity? A. Electronegativity is the energy...
- 09M.1.sl.TZ1.12: What happens when magnesium metal reacts with chlorine gas? A. Each magnesium atom loses...
- 09M.2.sl.TZ1.3c.ii: State the equation for the reaction of sodium oxide with water.
- 09M.2.sl.TZ1.5b.iii: A graph of atomic radius plotted against atomic number shows that the atomic radius decreases...
- 09M.2.sl.TZ1.5b.iv: Explain why a sulfide ion, \({{\text{S}}^{2 - }}\), is larger than a chloride ion,...
- 09M.2.sl.TZ1.3c.i: State the acid-base nature of sodium oxide.
- 09M.2.sl.TZ1.5b.i: Define the term first ionization energy and state what is meant by the term periodicity.
- 09M.2.sl.TZ1.5b.ii: State the electron arrangement of argon and explain why the noble gases, helium, neon and...
- 09M.2.sl.TZ1.5b.v: Explain why the melting points of the Group 1 metals \({\text{(Li}} \to {\text{Cs)}}\)...
- 09M.1.hl.TZ2.9: Which equation best represents the first ionization energy of magnesium? A. ...
- 09M.2.hl.TZ2.5d: Explain, using diagrams, why \({\text{N}}{{\text{O}}_{\text{2}}}\) is a polar molecule but...
- 09M.2.sl.TZ2.2a: Describe the acid-base character of the oxides of each of the period 3 elements, Na to Cl.
- 09M.1.sl.TZ2.8: Which statement describes the trends of electronegativity values in the periodic table? A. ...
- 09M.1.sl.TZ2.9: Which statement is correct for all elements in the same period? A. They have the same...
- 09M.2.sl.TZ2.7c: Explain, using diagrams, why CO and \({\text{N}}{{\text{O}}_{\text{2}}}\) are polar molecules...
- 11M.1.hl.TZ1.8: Which statement about the elements in group 7 is correct? A. ...
- 11M.2.hl.TZ1.6f.ii: Samples of sodium oxide and solid sulfur trioxide are added to separate beakers of water....
- 11M.1.sl.TZ1.8: Which property increases down group 1? A. First ionization energy B. Melting...
- 11M.1.sl.TZ1.7: Which property generally decreases across period 3? A. Atomic number B. ...
- 11M.1.sl.TZ1.12: Which combination of the characteristics of element X, a metal, and element Y, a non metal,...
- 11M.2.sl.TZ1.5a.ii: Explain why the first ionization energy of magnesium is higher than that of sodium.
- 11M.2.sl.TZ1.5b.i: calcium has a higher melting point than potassium.
- 11M.2.sl.TZ1.5a.i: Define the term first ionization energy.
- 11M.2.sl.TZ1.5d: Samples of sodium oxide and sulfur trioxide are added to separate beakers of water. Deduce...
- 11M.1.sl.TZ2.9: Which pair of elements has the greatest difference in electronegativity? A. Cs and...
- 11M.2.hl.TZ2.5b.iii: State the equations for the reactions of sodium oxide,...
- 11M.2.hl.TZ2.7e.ii: Explain why an aqueous solution of sodium chloride cannot be used to obtain sodium metal by...
- 11M.1.sl.TZ2.12: The number of electrons in the valence shell of elements A and B, are 6 and 7 respectively....
- 12M.1.sl.TZ2.9: Which series is correctly arranged in order of decreasing radius? A. ...
- 12M.2.sl.TZ2.3a: State the equation for the reaction between sodium and water.
- 12M.2.sl.TZ2.3b: State and explain one difference between the reactions of sodium and potassium with water.
- 11N.1.sl.TZ0.7: Which physical property of elements is represented by y on the graph below? A. First...
- 11N.2.sl.TZ0.1c.i: Suggest why it is necessary for sodium to be removed by this reaction.
- 11N.2.sl.TZ0.5a: Deduce the balanced chemical equation for the reaction between sodium and sulfur. State the...
- 11N.2.sl.TZ0.5b: Describe the acid-base character of the oxides of the period 3 elements, Na to Cl. For the...