| Date | May 2015 | Marks available | 3 | Reference code | 15M.2.sl.TZ2.1 |
| Level | SL | Paper | 2 | Time zone | TZ2 |
| Command term | Calculate | Question number | 1 | Adapted from | N/A |
Question
A student carried out an experiment to determine the concentration of a hydrochloric acid solution and the enthalpy change of the reaction between aqueous sodium hydroxide and this acid by thermometric titration.
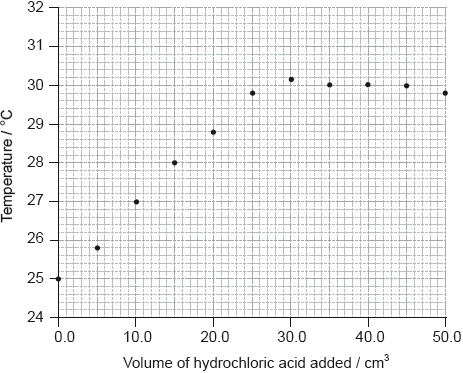
She added \({\text{5.0 c}}{{\text{m}}^{\text{3}}}\) portions of hydrochloric acid to \({\text{25.0 c}}{{\text{m}}^{\text{3}}}\) of \({\text{1.00 mol}}\,{\text{d}}{{\text{m}}^{ - 3}}\) sodium hydroxide solution in a glass beaker until the total volume of acid added was \({\text{50.0 c}}{{\text{m}}^{\text{3}}}\), measuring the temperature of the mixture each time. Her results are plotted in the graph below.

The initial temperature of both solutions was the same.
By drawing appropriate lines, determine the volume of hydrochloric acid required to completely neutralize the \({\text{25.0 c}}{{\text{m}}^{\text{3}}}\) of sodium hydroxide solution.
Determine the concentration of the hydrochloric acid, including units.
Determine the change in temperature, \(\Delta T\).
Calculate the enthalpy change, in \({\text{kJ}}\,{\text{mo}}{{\text{l}}^{ - 1}}\), for the reaction of hydrochloric acid and sodium hydroxide solution.
The accepted theoretical value from the literature of this enthalpy change is \( - 58{\text{ kJ}}\,{\text{mo}}{{\text{l}}^{ - 1}}\). Calculate the percentage error correct to two significant figures.
Suggest the major source of error in the experimental procedure and an improvement that could be made to reduce it.
Markscheme
drawing best-fit straight lines to show volume;
There should be approximately the same number of points above and below for both lines.
\({\text{27.0 (c}}{{\text{m}}^{\text{3}}}{\text{)}}\);
Accept any value in the range 26.0 to 28.0 (cm3) if consistent with student’s annotation on the graph.
Accept ECF for volumes in the range 27.0–30.0 cm3 if it corresponds to maximum temperature of line drawn.
Volumes should be given to one decimal place.
\({\text{[HCl]}} = \frac{{1.00 \times 0.0250}}{{0.0270}}\);
\( = 0.926{\text{ mol}}\,{\text{d}}{{\text{m}}^{ - 3}}\);
Volume of 26.0 gives [HCl] = 0.962 mol dm–3. Volume of 28.0 gives [HCl] = 0.893 mol dm–3
Award [2] for correct final answer with units.
Award [1 max] for correct concentration without units.
Accept M, mol L–1, mol/dm3 as units.
\((30.2 - 25.0 = )( + )5.2{\rm{ (^\circ C/K)}}\);
Any accepted value must be consistent with student’s annotation on the graph but do not accept \(\Delta T < 5.1\).
Accept \(( + )5.6{\rm{ (^\circ C/K) }}\) (ie, taking into account heat loss and using T when volume = 0.0 cm3).
\({\text{Q}} = (m \times c \times \Delta T = (25.0 + 27.0) \times 4.18 \times 5.2 = 1130.272{\text{ J}} = )1.13{\text{ (kJ)}}\);
\(n = (1.00 \times 0.0250 = )0.0250{\text{ (mol)}}\);
\(\Delta H = \left( { - \frac{Q}{n} = - 45210.88{\text{ J}}\,{\text{mo}}{{\text{l}}^{ - 1}} = } \right) - 45{\text{ (kJ}}\,{\text{mo}}{{\text{l}}^{ - 1}}{\text{)}}\);
Award [3] for correct final answer.
Award [2] for +45 (kJ mol –1).
Apply ECF for M3 even if both m and \(\Delta T\) are incorrect in M1.
Accept use of c = 4.2 Jg–1K–1.
\(\left( {\left| {\frac{{ - 45 - ( - 58)}}{{( - 58)}}} \right| \times 100 = } \right)22(\% )\);
Answer must be given to two significant figures.
Ignore sign.
heat losses;
better (thermal) insulation / using a polystyrene cup / putting a lid on the beaker;
Accept other suitable methods for better thermal insulation, but do not accept just "use a calorimeter" without reference to insulation.
Examiners report
Some teachers commented that thermometric titrations are not listed in the syllabus nor are they included as prescribed experiments for the new guide. A similar question was asked in a past examination and thermometric titrations are covered in Topic 5. The intention is that any data based questions should be accessible to all students, who have the appropriate practical experience. It is not intended that such questions will be constrained to experiments on this list. Most candidates were not able to access the first mark with by construction of lines of best fit. Some drew a 'dot to dot' curve, but with most just providing a construction line dropping down from the maximum point on the graph, which did allow them to access the second mark. There was some transferred error for 1aii), but many were not able to carry out the calculation. Scoring for the temperature difference was dependent upon on the candidate's annotations, with a few extending the line of best fit back to the y axis. In the calculation of enthalpy change, the total mass of the solutions was often incorrect, but some salvaged the subsequent marks. The calculation of percentage error was generally done well, but a good third of the candidates failed to read the question stem and did not give the answer to two significant figures. The concept of heat loss in the experiment was well understood, but the solution was very often too vague.
Some teachers commented that thermometric titrations are not listed in the syllabus nor are they included as prescribed experiments for the new guide. A similar question was asked in a past examination and thermometric titrations are covered in Topic 5. The intention is that any data based questions should be accessible to all students, who have the appropriate practical experience. It is not intended that such questions will be constrained to experiments on this list. Most candidates were not able to access the first mark with by construction of lines of best fit. Some drew a 'dot to dot' curve, but with most just providing a construction line dropping down from the maximum point on the graph, which did allow them to access the second mark. There was some transferred error for 1aii), but many were not able to carry out the calculation. Scoring for the temperature difference was dependent upon on the candidate's annotations, with a few extending the line of best fit back to the y axis. In the calculation of enthalpy change, the total mass of the solutions was often incorrect, but some salvaged the subsequent marks. The calculation of percentage error was generally done well, but a good third of the candidates failed to read the question stem and did not give the answer to two significant figures. The concept of heat loss in the experiment was well understood, but the solution was very often too vague.
Some teachers commented that thermometric titrations are not listed in the syllabus nor are they included as prescribed experiments for the new guide. A similar question was asked in a past examination and thermometric titrations are covered in Topic 5. The intention is that any data based questions should be accessible to all students, who have the appropriate practical experience. It is not intended that such questions will be constrained to experiments on this list. Most candidates were not able to access the first mark with by construction of lines of best fit. Some drew a 'dot to dot' curve, but with most just providing a construction line dropping down from the maximum point on the graph, which did allow them to access the second mark. There was some transferred error for 1aii), but many were not able to carry out the calculation. Scoring for the temperature difference was dependent upon on the candidate's annotations, with a few extending the line of best fit back to the y axis. In the calculation of enthalpy change, the total mass of the solutions was often incorrect, but some salvaged the subsequent marks. The calculation of percentage error was generally done well, but a good third of the candidates failed to read the question stem and did not give the answer to two significant figures. The concept of heat loss in the experiment was well understood, but the solution was very often too vague.
Some teachers commented that thermometric titrations are not listed in the syllabus nor are they included as prescribed experiments for the new guide. A similar question was asked in a past examination and thermometric titrations are covered in Topic 5. The intention is that any data based questions should be accessible to all students, who have the appropriate practical experience. It is not intended that such questions will be constrained to experiments on this list. Most candidates were not able to access the first mark with by construction of lines of best fit. Some drew a 'dot to dot' curve, but with most just providing a construction line dropping down from the maximum point on the graph, which did allow them to access the second mark. There was some transferred error for 1aii), but many were not able to carry out the calculation. Scoring for the temperature difference was dependent upon on the candidate's annotations, with a few extending the line of best fit back to the y axis. In the calculation of enthalpy change, the total mass of the solutions was often incorrect, but some salvaged the subsequent marks. The calculation of percentage error was generally done well, but a good third of the candidates failed to read the question stem and did not give the answer to two significant figures. The concept of heat loss in the experiment was well understood, but the solution was very often too vague.
Some teachers commented that thermometric titrations are not listed in the syllabus nor are they included as prescribed experiments for the new guide. A similar question was asked in a past examination and thermometric titrations are covered in Topic 5. The intention is that any data based questions should be accessible to all students, who have the appropriate practical experience. It is not intended that such questions will be constrained to experiments on this list. Most candidates were not able to access the first mark with by construction of lines of best fit. Some drew a 'dot to dot' curve, but with most just providing a construction line dropping down from the maximum point on the graph, which did allow them to access the second mark. There was some transferred error for 1aii), but many were not able to carry out the calculation. Scoring for the temperature difference was dependent upon on the candidate's annotations, with a few extending the line of best fit back to the y axis. In the calculation of enthalpy change, the total mass of the solutions was often incorrect, but some salvaged the subsequent marks. The calculation of percentage error was generally done well, but a good third of the candidates failed to read the question stem and did not give the answer to two significant figures. The concept of heat loss in the experiment was well understood, but the solution was very often too vague.
Some teachers commented that thermometric titrations are not listed in the syllabus nor are they included as prescribed experiments for the new guide. A similar question was asked in a past examination and thermometric titrations are covered in Topic 5. The intention is that any data based questions should be accessible to all students, who have the appropriate practical experience. It is not intended that such questions will be constrained to experiments on this list. Most candidates were not able to access the first mark with by construction of lines of best fit. Some drew a 'dot to dot' curve, but with most just providing a construction line dropping down from the maximum point on the graph, which did allow them to access the second mark. There was some transferred error for 1aii), but many were not able to carry out the calculation. Scoring for the temperature difference was dependent upon on the candidate's annotations, with a few extending the line of best fit back to the y axis. In the calculation of enthalpy change, the total mass of the solutions was often incorrect, but some salvaged the subsequent marks. The calculation of percentage error was generally done well, but a good third of the candidates failed to read the question stem and did not give the answer to two significant figures. The concept of heat loss in the experiment was well understood, but the solution was very often too vague.