| Date | May 2009 | Marks available | 2 | Reference code | 09M.2.sl.TZ2.2 |
| Level | SL only | Paper | 2 | Time zone | TZ2 |
| Command term | Complete | Question number | 2 | Adapted from | N/A |
Question
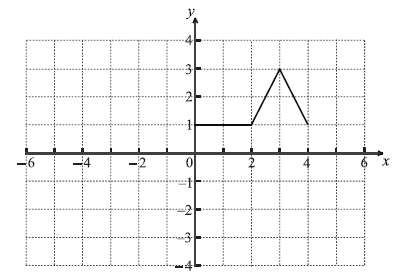
Consider the graph of \(f\) shown below.

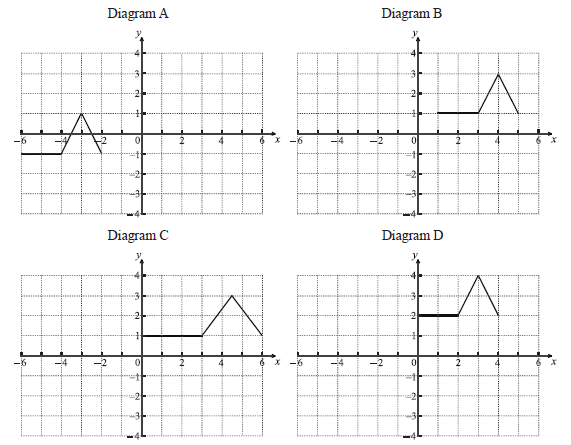
The following four diagrams show images of f under different transformations.

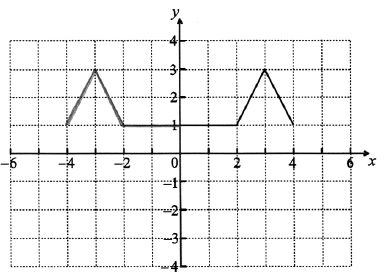
On the same grid sketch the graph of \(y = f( - x)\) .
Complete the following table.

Give a full geometric description of the transformation that gives the image in Diagram A.
Markscheme
 A2 N2
A2 N2
[2 marks]
 A1A1 N2
[2 marks]
translation (accept move/shift/slide etc.) with vector \(\left( {\begin{array}{*{20}{c}}
{ - 6}\\
{ - 2}
\end{array}} \right)\) A1A1 N2
[2 marks]
Examiners report
This question was reasonably solved by many students, though a good number confused \(f( - x)\) with \( - f(x)\) in part (a), thus reflecting the original diagram in the x-axis. Candidates need more practice in correctly and fully describing transformations.
Candidates need more practice in correctly and fully describing transformations. There was often confusion between the description of the transformation and the equation that represents it. A fairly low percentage of the candidates used the term "translation".
Candidates need more practice in correctly and fully describing transformations. There was often confusion between the description of the transformation and the equation that represents it. A fairly low percentage of the candidates used the term "translation".

