| Date | May 2009 | Marks available | 2 | Reference code | 09M.1.sl.TZ1.4 |
| Level | SL only | Paper | 1 | Time zone | TZ1 |
| Command term | Write down | Question number | 4 | Adapted from | N/A |
Question
The following diagram shows the graphs of the displacement, velocity and acceleration of a moving object as functions of time, t.
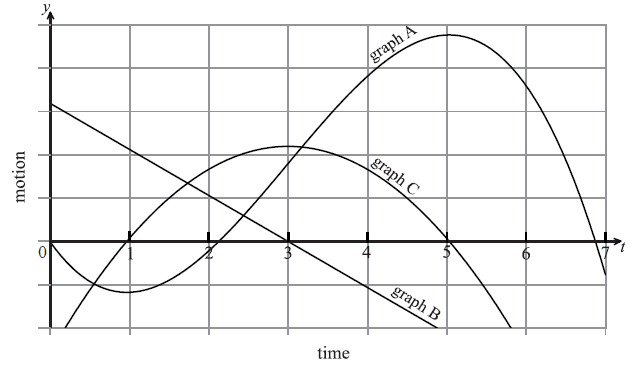
Complete the following table by noting which graph A, B or C corresponds to each function.
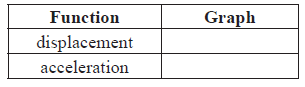
[4]
a.
Write down the value of t when the velocity is greatest.
[2]
b.
Markscheme
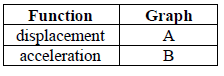 A2A2 N4
[4 marks]
a.
\(t = 3\) A2 N2
[2 marks]
b.
Examiners report
Many candidates answered this question completely and correctly, showing a good understanding of the graphical relationship between displacement, velocity and acceleration. When done incorrectly, many answered with the displacement as graph B and acceleration as graph C.
a.
Many candidates found the value of t which gave a maximum in the remaining graph, and were awarded follow through marks.
b.
Syllabus sections
Topic 6 - Calculus » 6.6 » Kinematic problems involving displacement \(s\), velocity \(v\) and acceleration \(a\).
Show 53 related questions