 Bivariate Data
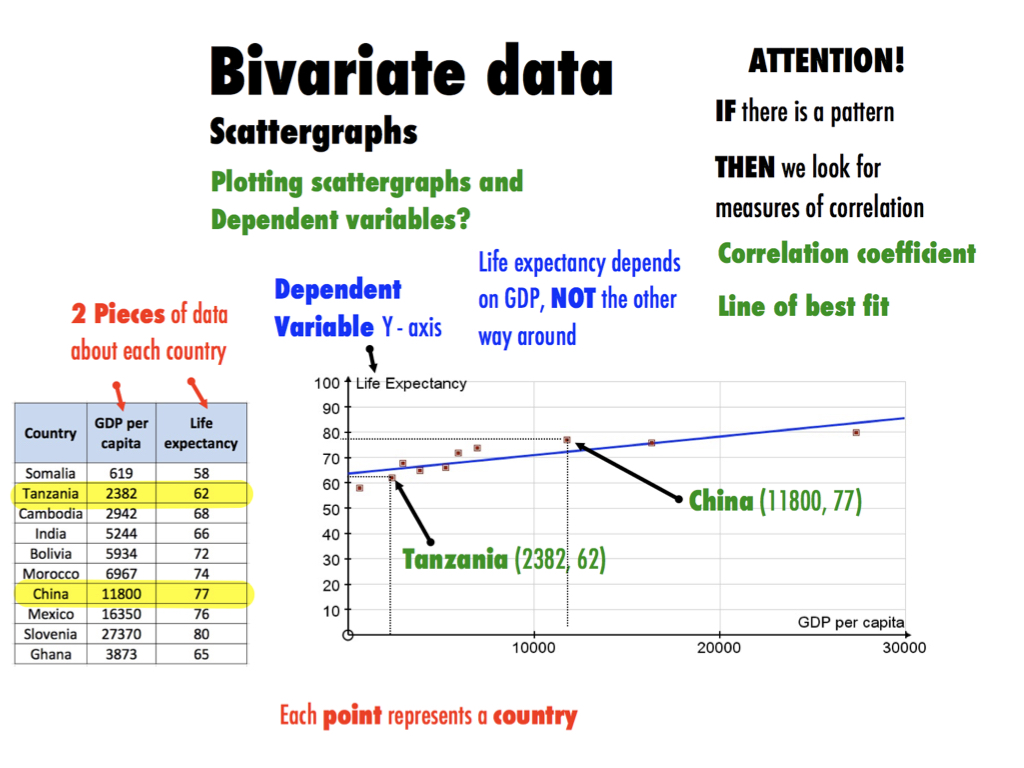
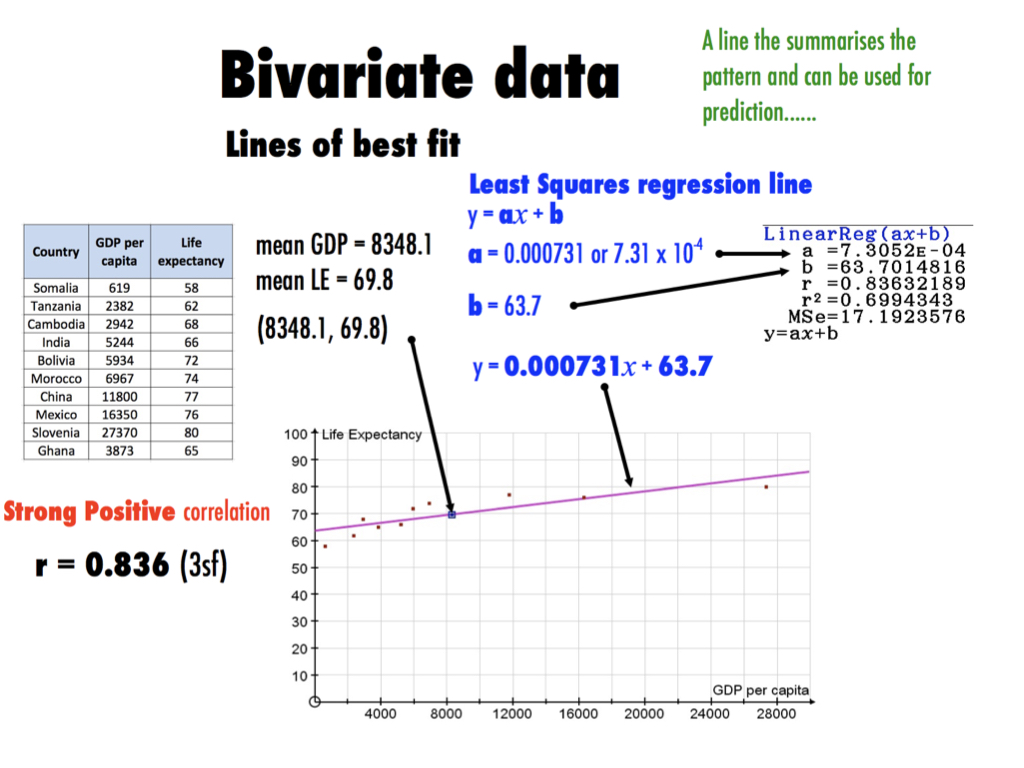
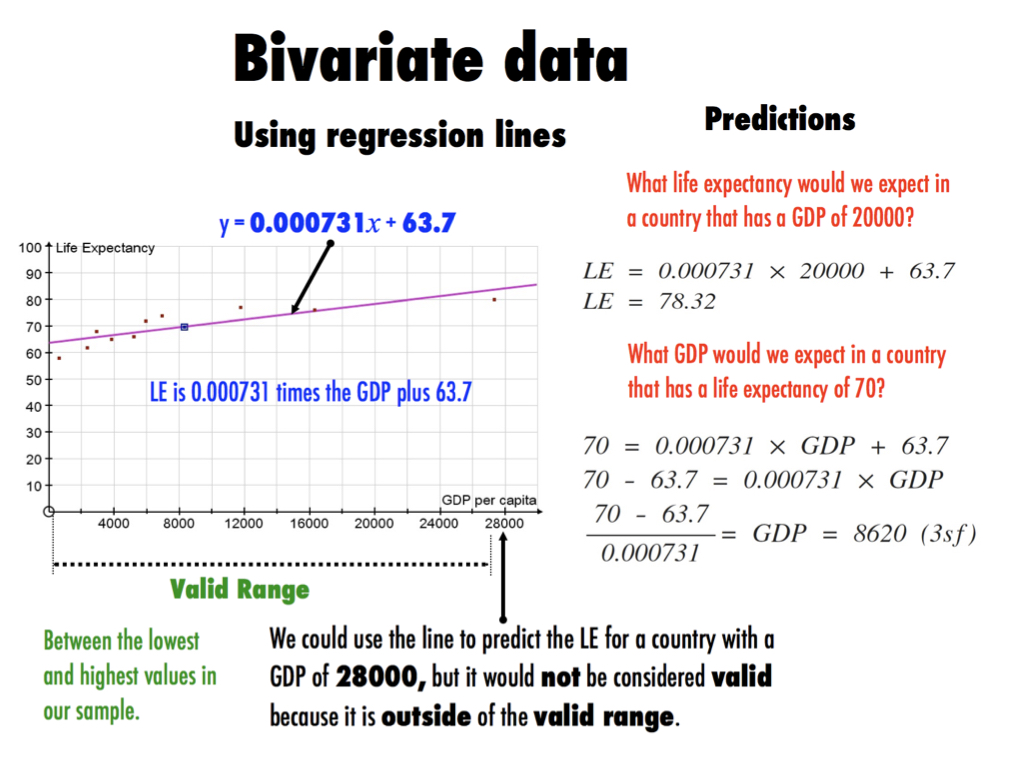
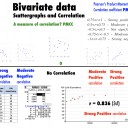
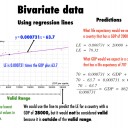
This topic is all about looking for relationships between variables. Does life expectancy depend on GDP? By collecting 2 variables about the things we survey we can use scatter graphs to represent the data and then look for correlation and models that we can then use for prediction.
In this unit you should learn to…
-
Collect, present and analyse 2 variable data looking for linear correlation
-
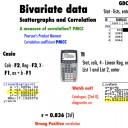
Calculate the Pearson's Product Moment Correlation Coefficient as a measure of degree of correlation
-
Calculate and use a regression line that models data that shows correlation.
Revision Card - Review this condensed 'key point' revision card to help you check and keep ideas fresh in your mind.

Self Checking Quiz
Practice your understanding on these quiz questions. Check your answers when you are done and read the hints where you got stuck. If you find there are still some gaps in your understanding then go back to the videos and slides above.
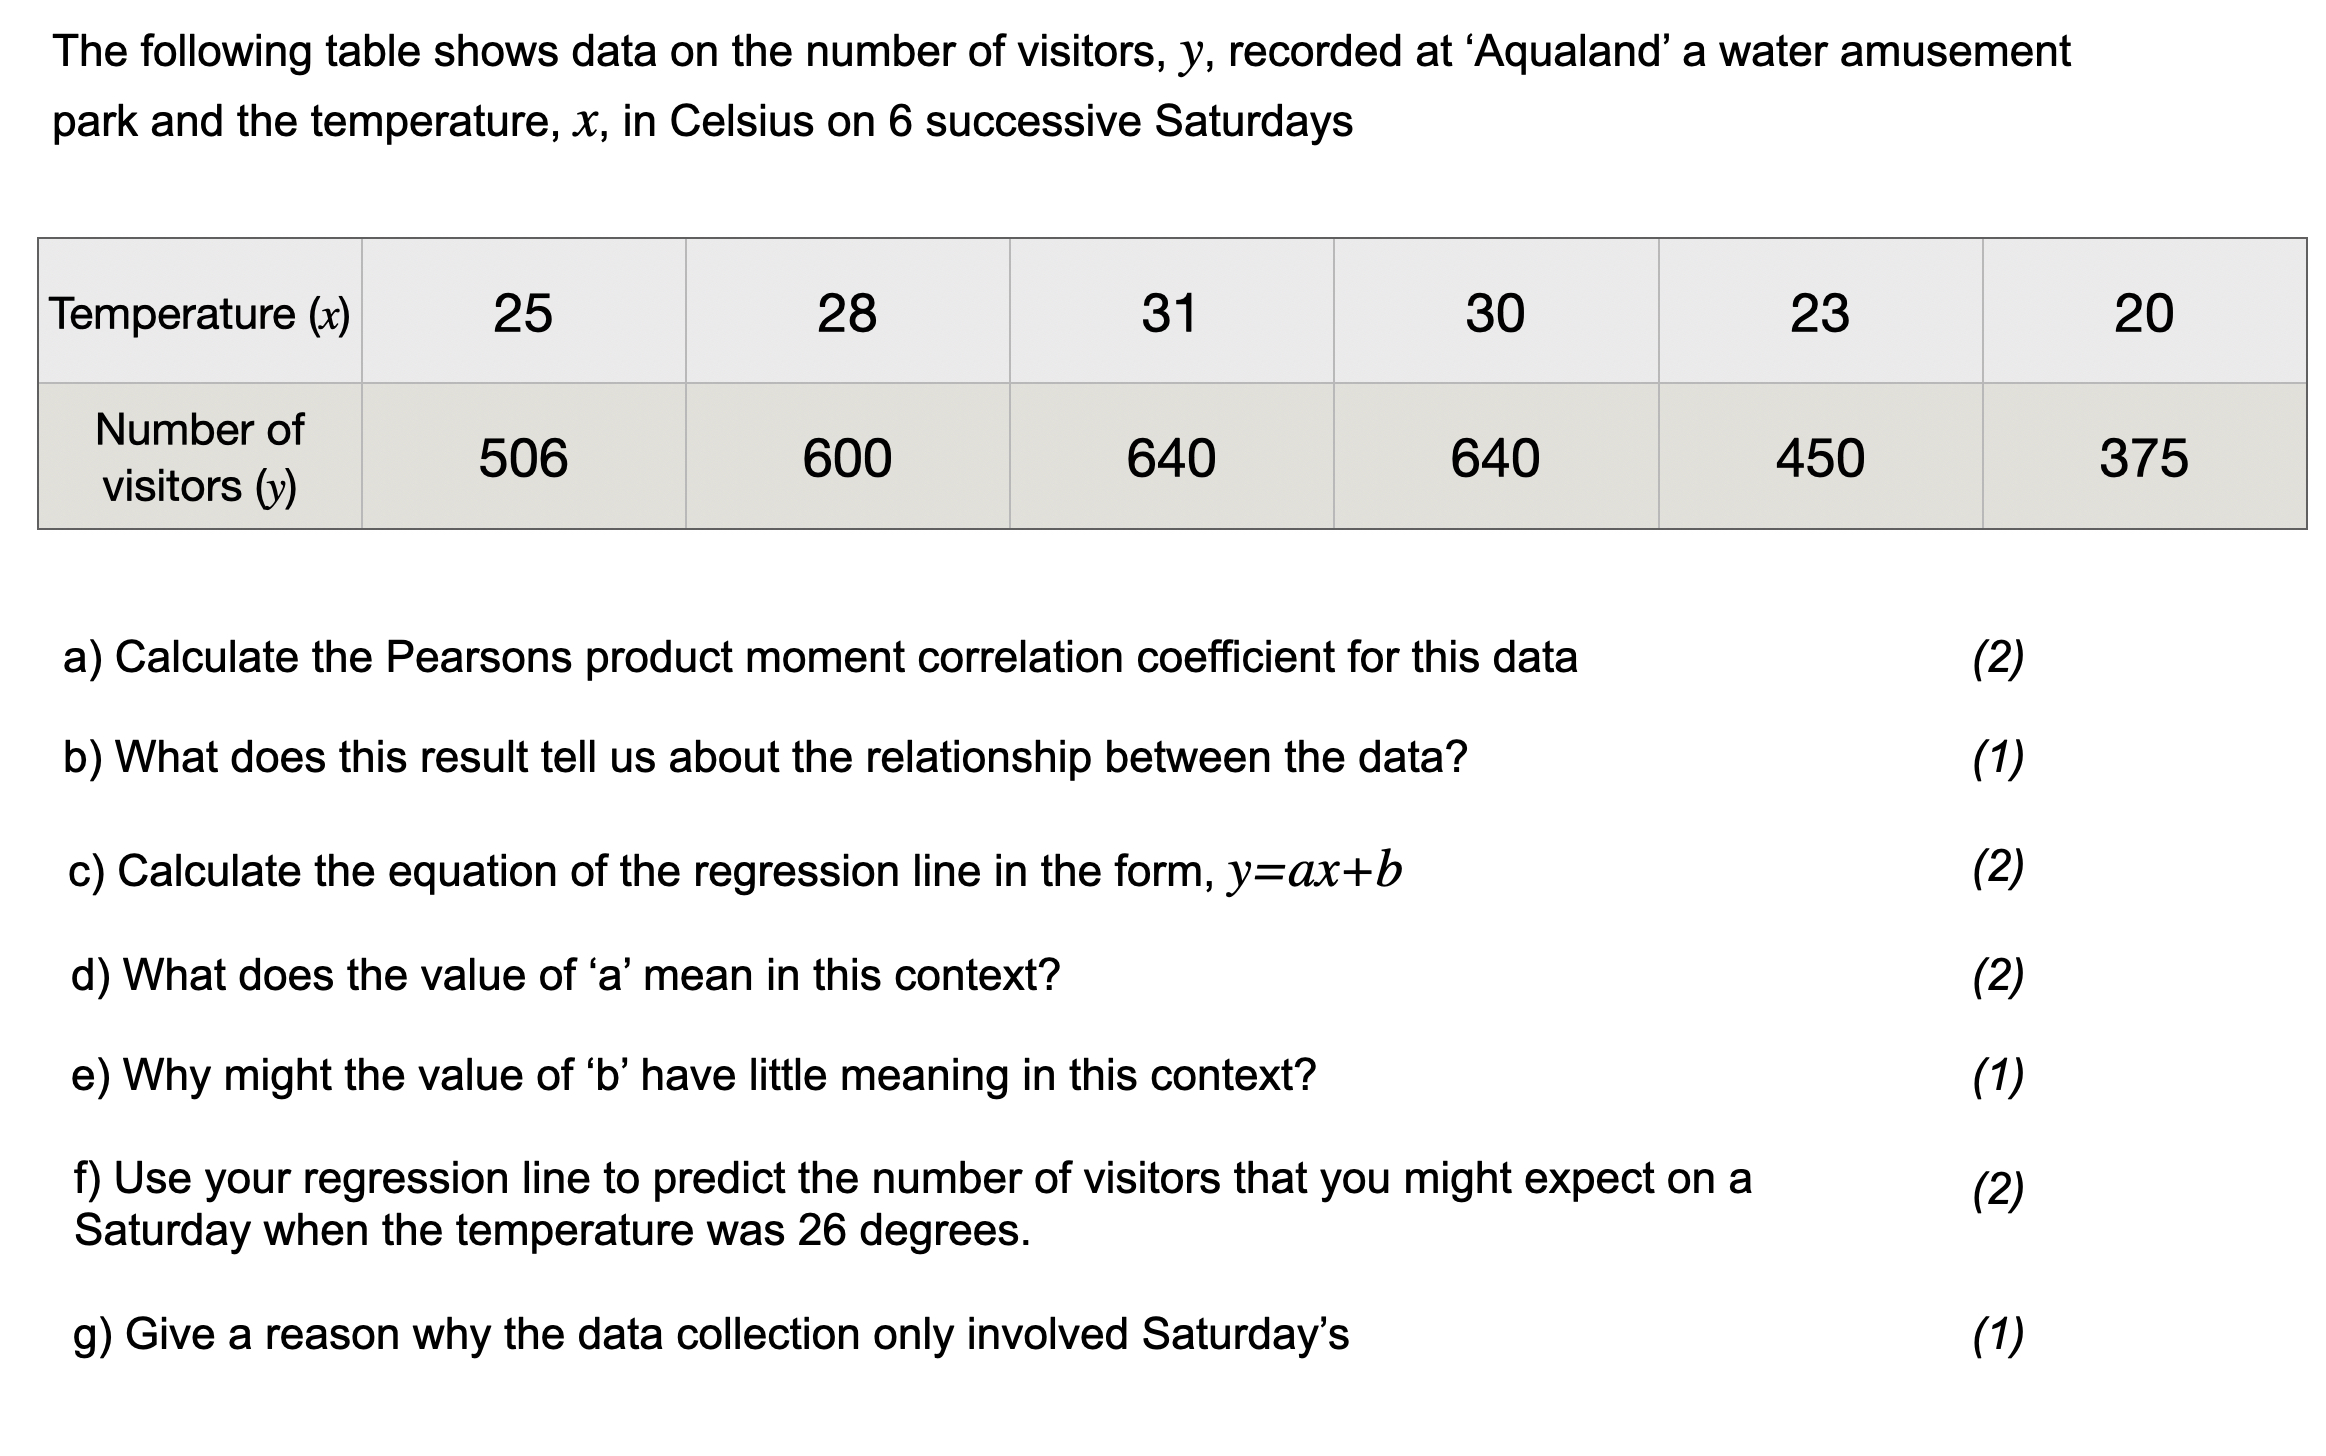
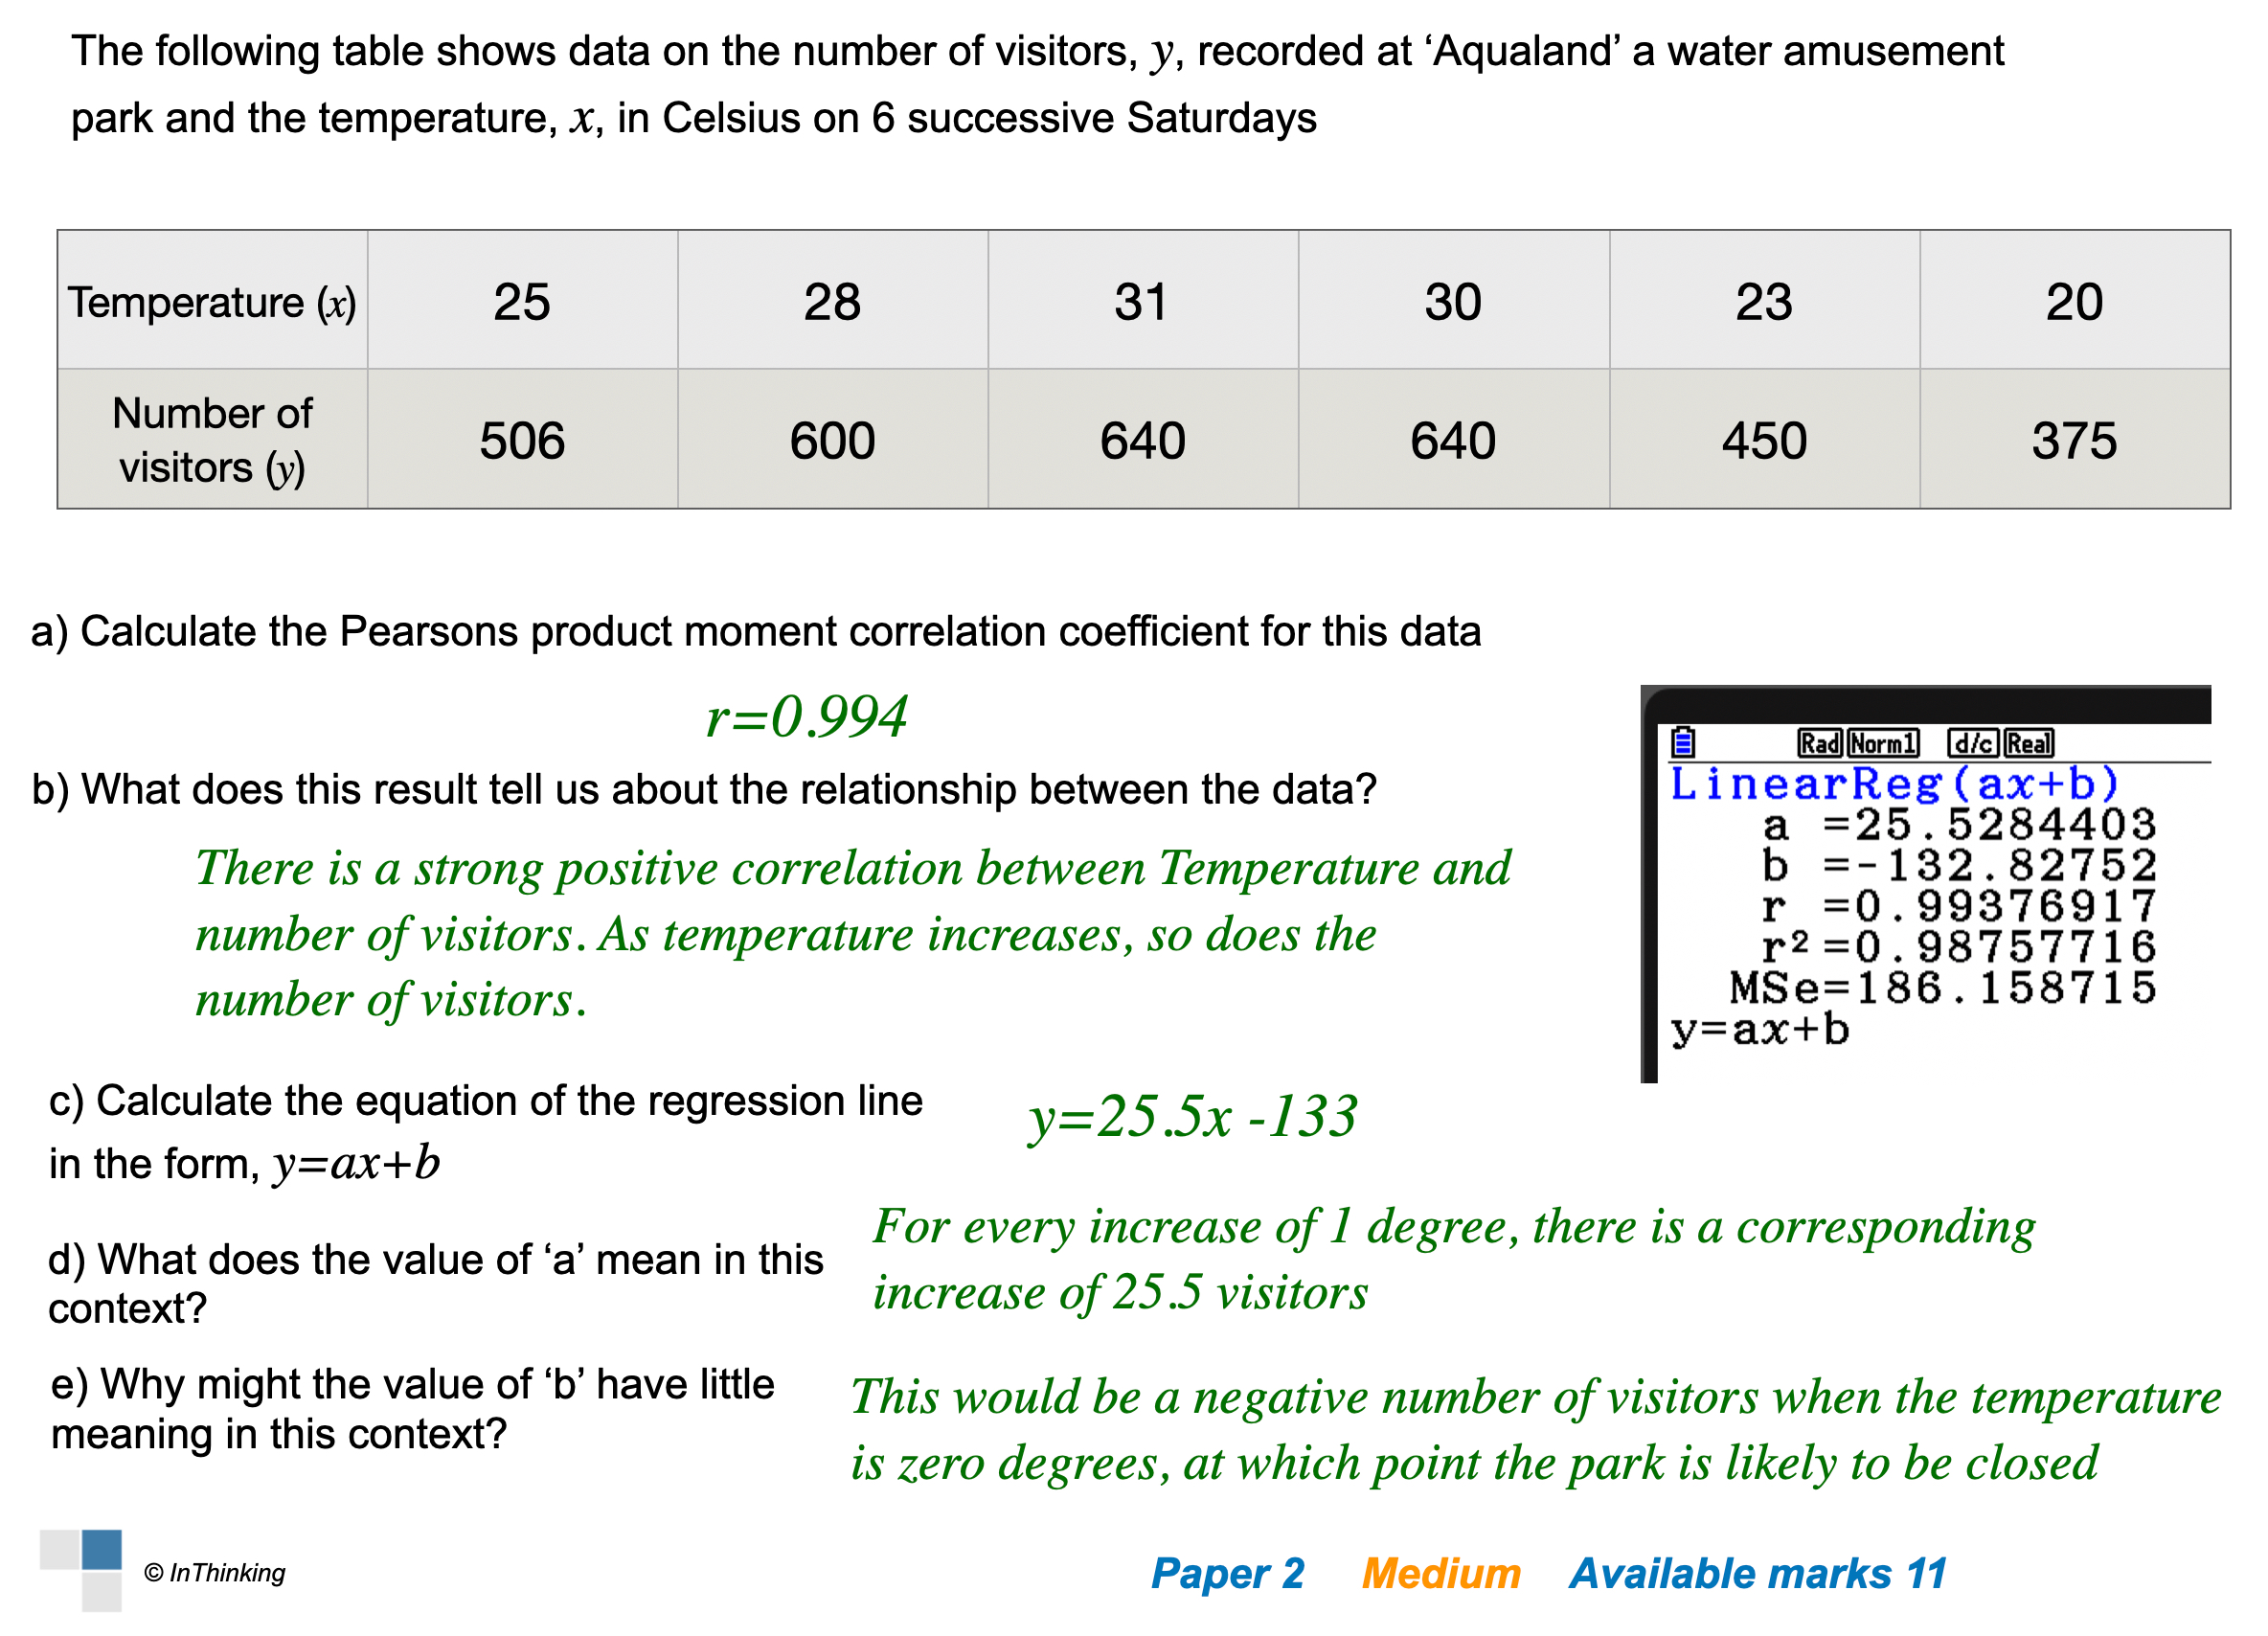
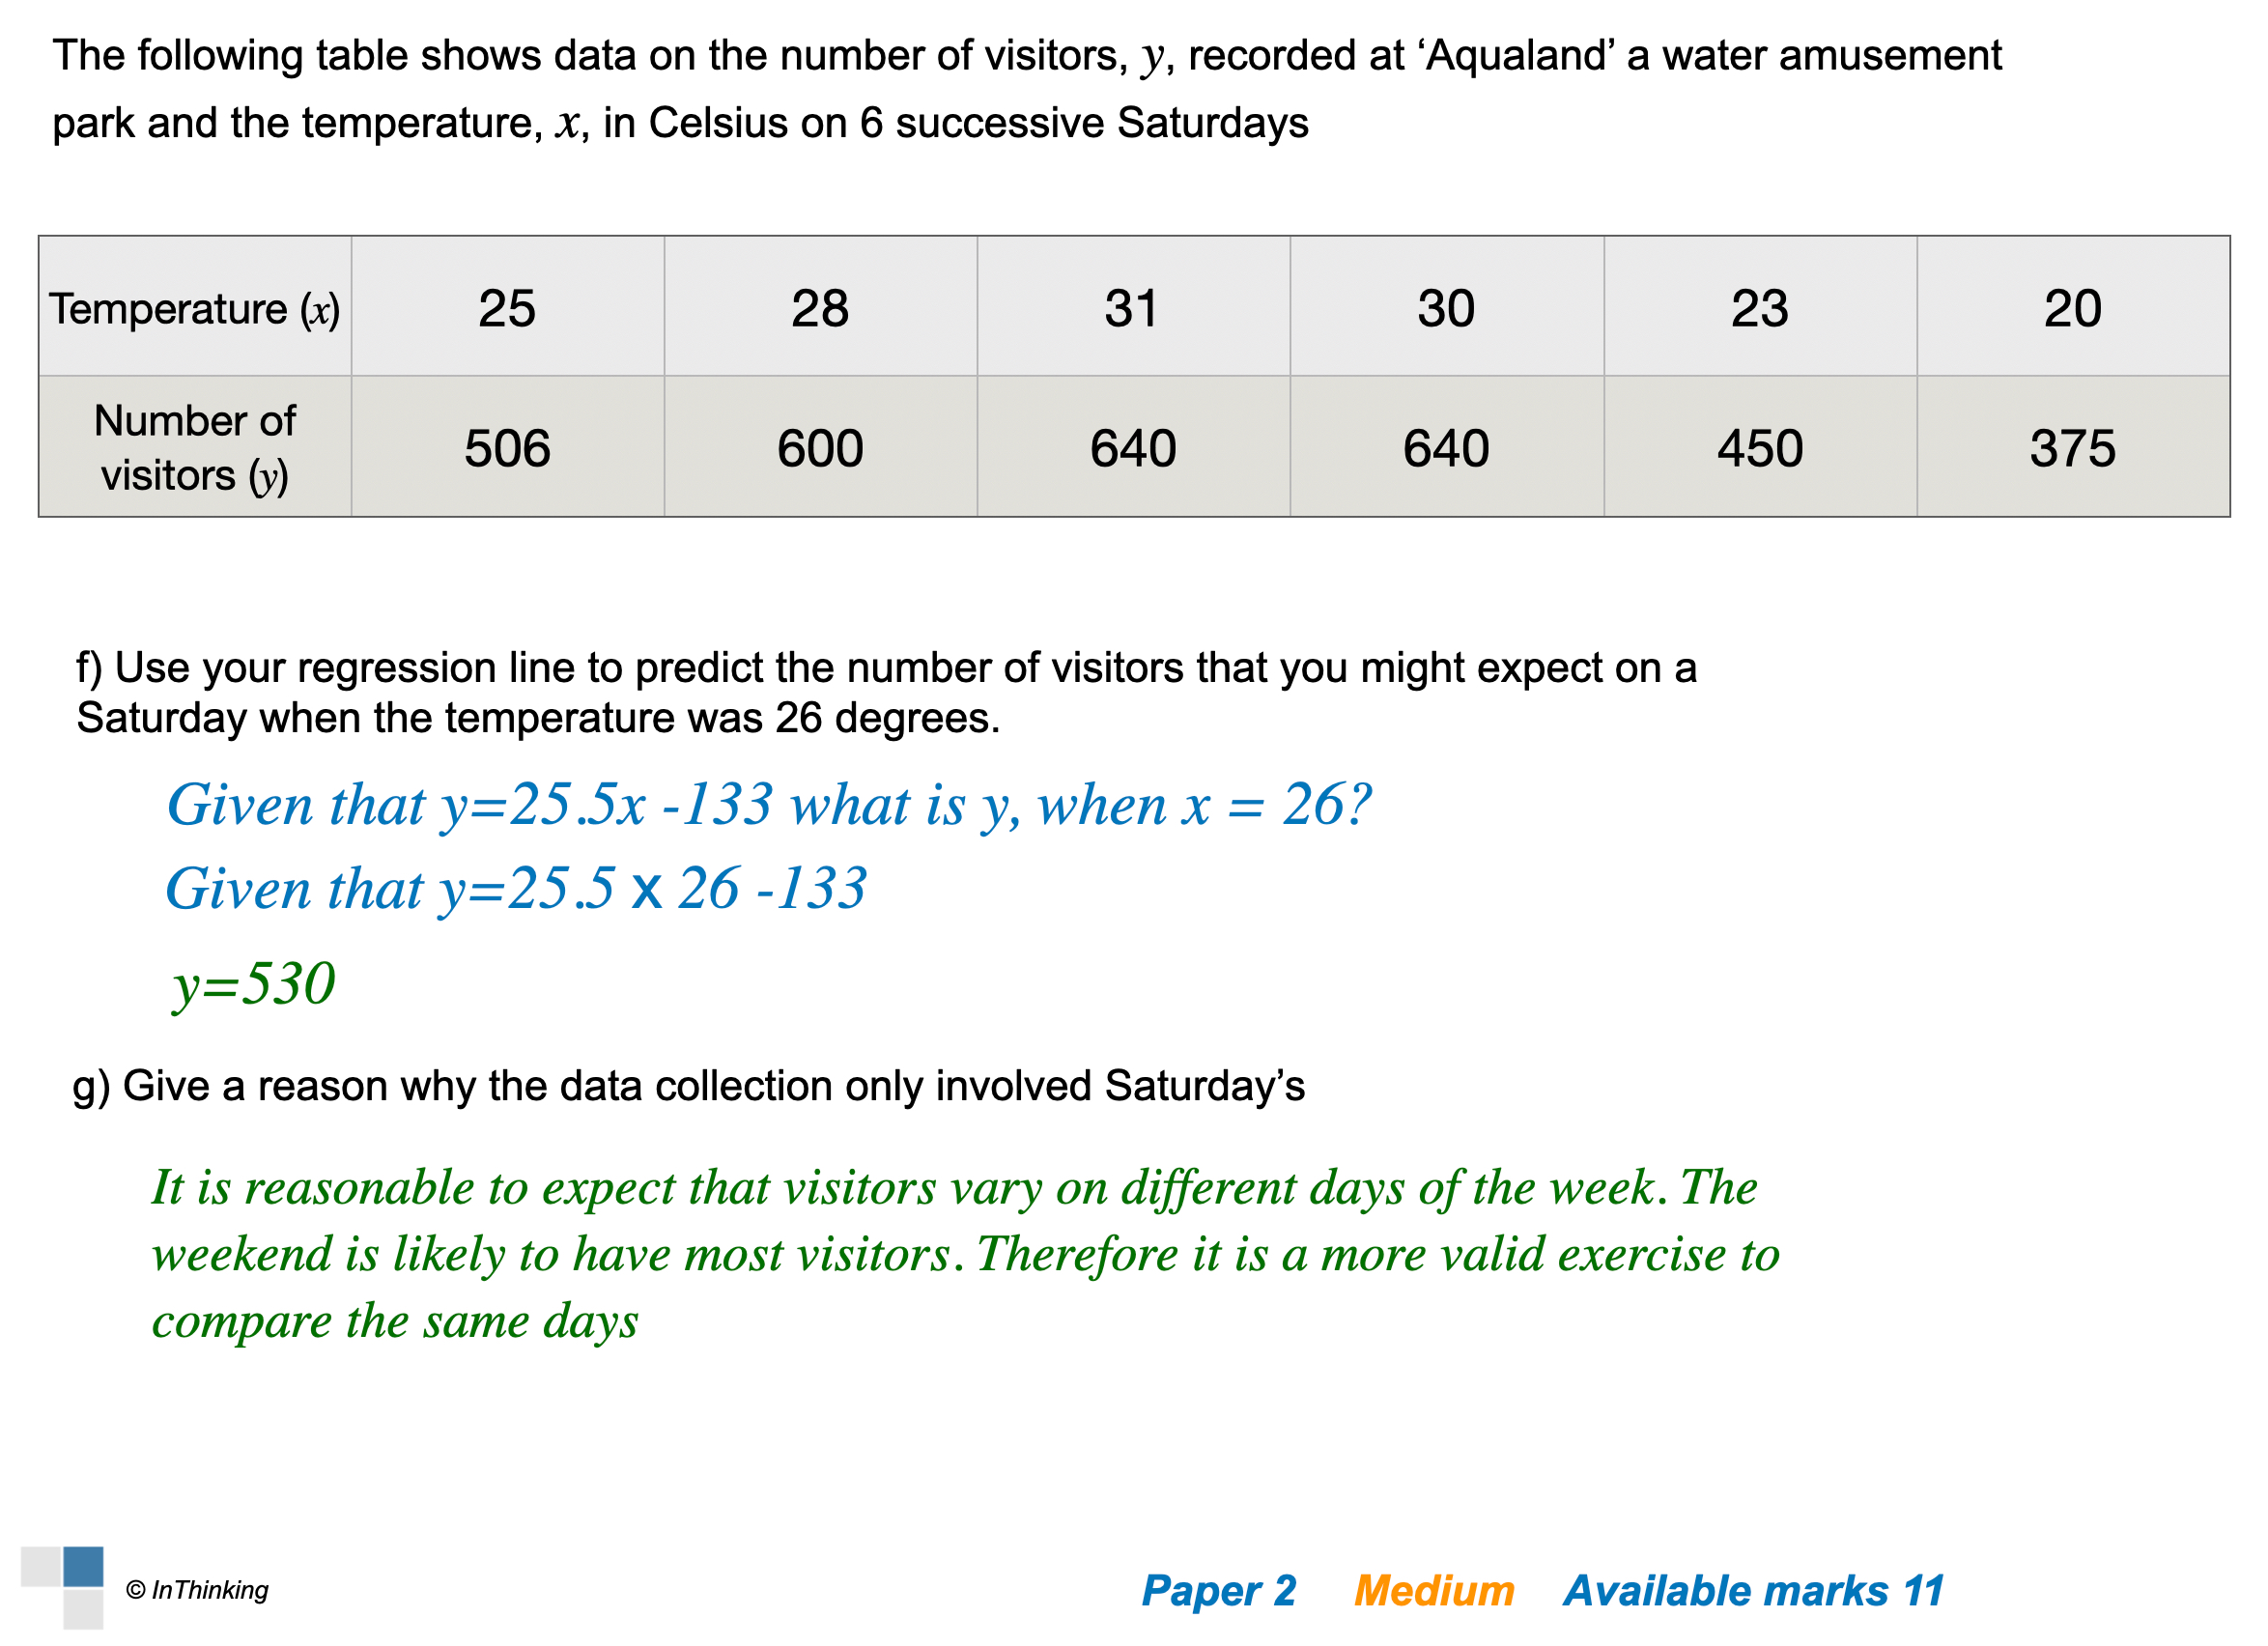
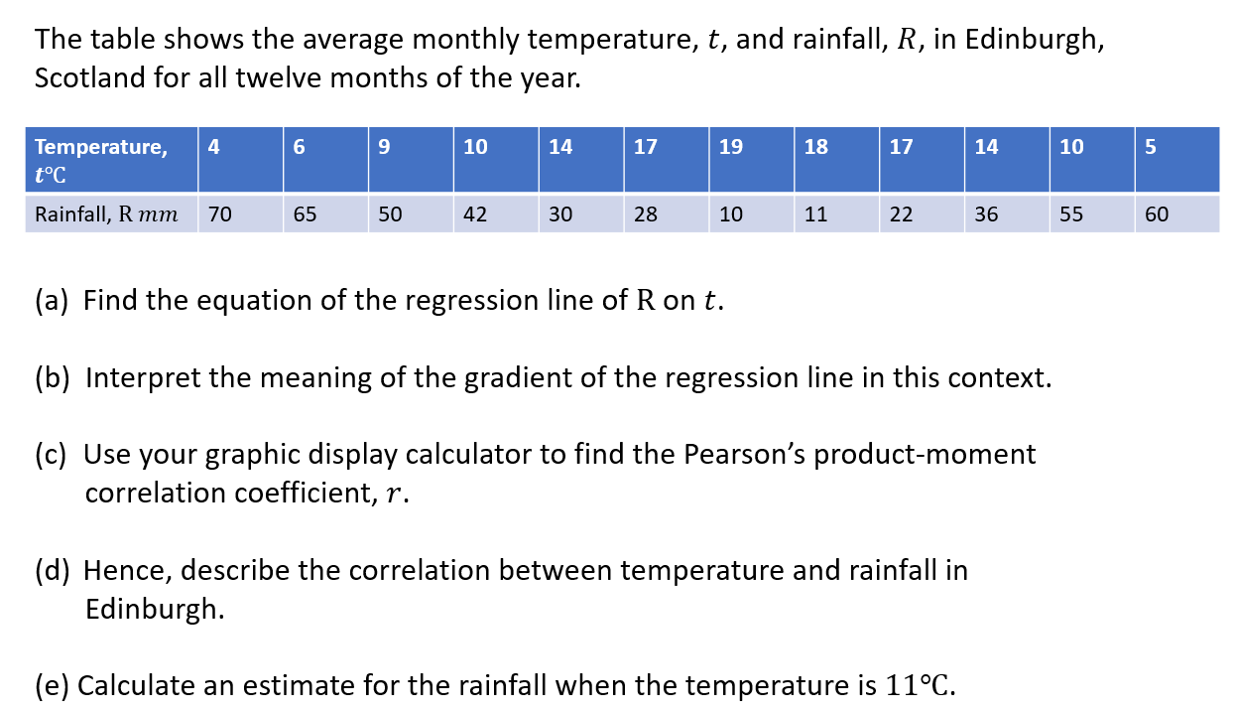
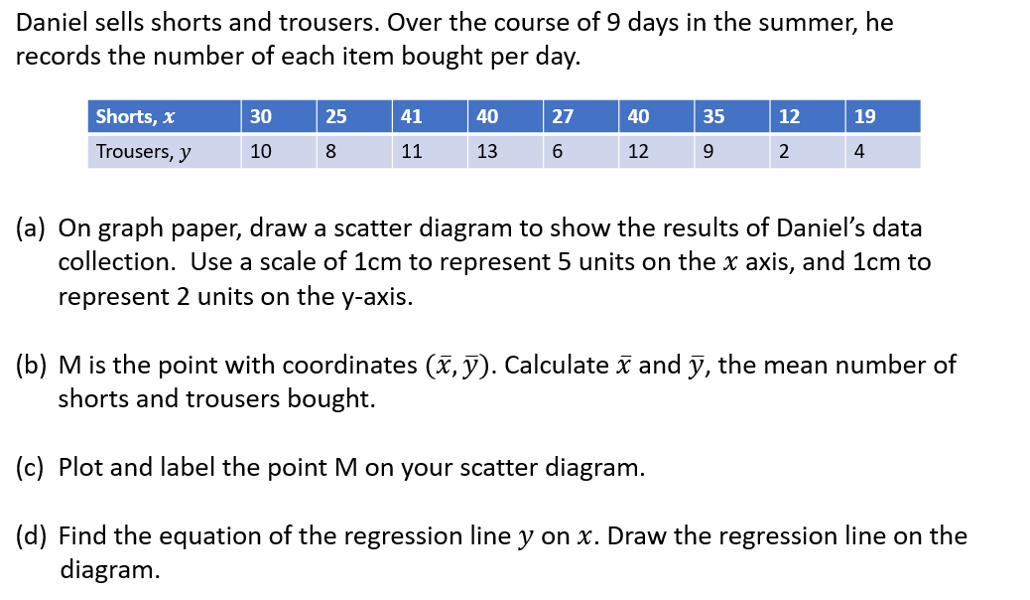
The following questions are based on IB exam style questions from past exams. You should print these off (from the document at the top) and try to do these questions under exam conditions. Then you can check your work with the video solution.
How much of 4.4 Bivariate data & Linear Correlation have you understood?









 Twitter
  Facebook
  LinkedIn