0%
DP IB Maths: AI HL
Topic Questions
4.11 Hypothesis Testing
Question 9a
Melanie is playing an online game which has two digital four-sided dice numbered 1 to 4. The pair of digital dice are rolled together three times and points are scored. High points are scored for rolling doubles this is when both dice land on the same number.
The following table shows the distribution of the number of doubles scored in each set of three throws when the Melanie plays the game 400 times.
|
Number of doubles |
0 |
1 |
2 |
3 |
|
Frequency |
148 |
174 |
66 |
12 |
Melanie suspects that the data can be modelled using a binomial distribution with the probability of rolling a double being 0.25. A goodness of fit test is to be used with a 5% significance level to test Melanie’s suspicion.
a)
Perform the test to show that the data can not be modelled accurately by the binomial distribution B(3, 0.25).
Question 9b
Melanie still suspects that the data can be modelled using a binomial distribution. A goodness of fit test is to be used with a 5% significance level to test Melanie’s suspicion.
b)
Assuming that each dice roll is independent, use the table of results to estimate the probability of rolling doubles with the pair of dice.
Question 9c
c)
(i)
Write down the number of degrees of freedom for her test.
(ii)
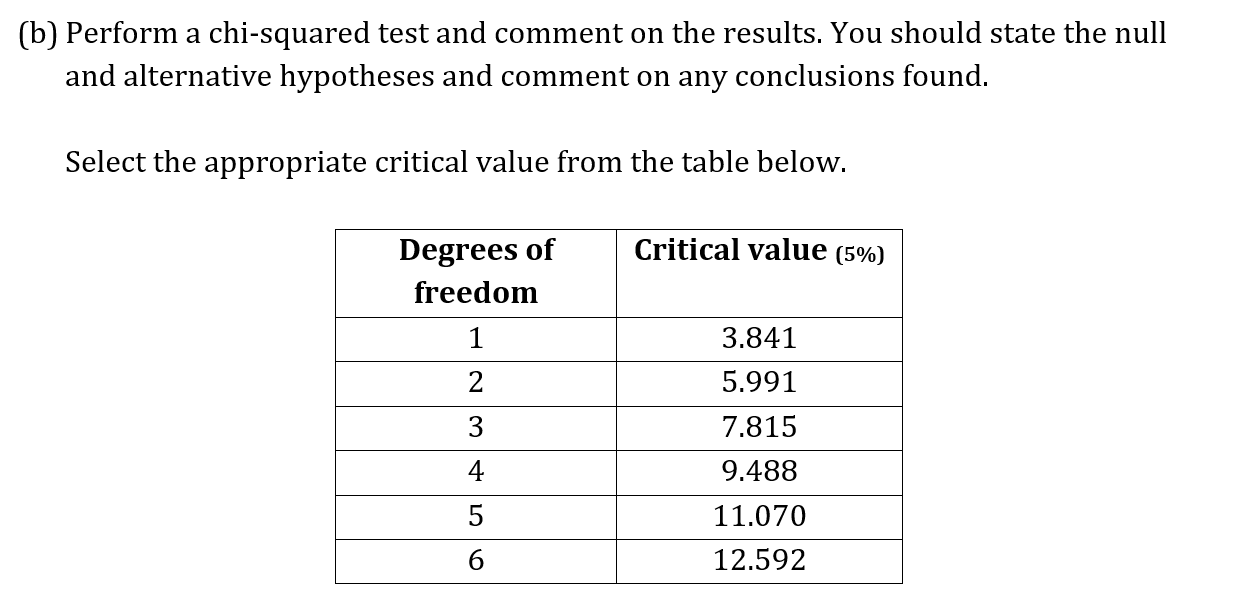
Perform the  goodness of fit test and state, with reason, a conclusion.
Question 10a
Gordon takes the bus to work at the same time each day and he records the time, in minutes, of each journey. He collates his data in the table below.
|
Time (t minutes) |
Frequency |
|
6 |
|
|
11 |
|
|
17 |
|
|
21 |
|
|
14 |
|
|
1 |
Gordon wants to use a goodness of fit test with a 10% significance level to see whether the journey times can be modelled by a normal distribution.
a)
State the null and alternative hypotheses.
Question 10b
The mean time of the sample is 25.3 minutes and the standard deviation for the sample is 7.38 minutes.
b)
Write down the unbiased estimate for the population mean time and find the unbiased estimate for the population variance.
Question 10c
c)
Calculate the expected frequencies if the data were normally distributed using the unbiased estimates found in part (b). Complete the table below giving the frequencies to 3 decimal places.
|
Time (t minutes) |
Expected Frequency |
|
|
|
|
10.850 |
|
|
17.219 |
|
|
17.675 |
|
|
|
|
|
1.679 |
Question 10d
d)
Write down the number of degrees of freedom for the test.
Question 10e
e)
The critical value for the test is 4.605. State the conclusion of the test. Give a reason for your answer.


