| Date | May 2017 | Marks available | 2 | Reference code | 17M.2.SL.TZ2.S_3 |
| Level | Standard Level | Paper | Paper 2 | Time zone | Time zone 2 |
| Command term | Write down | Question number | S_3 | Adapted from | N/A |
Question
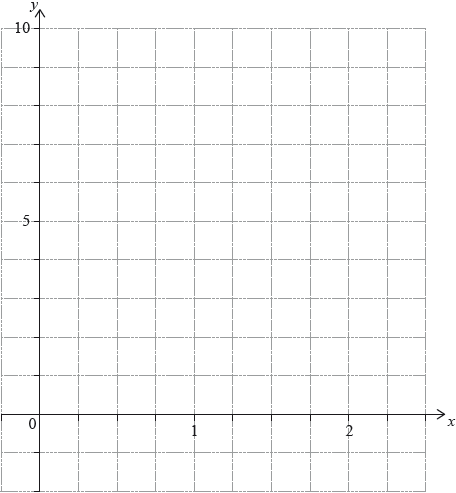
The following diagram shows the graph of a function , for .
The points and lie on the graph of . There is a minimum point at .

Write down the range of .
Markscheme
* This question is from an exam for a previous syllabus, and may contain minor differences in marking or structure.
correct interval A2 N2
eg, from 0 to 6
[2 marks]
Examiners report
Syllabus sections
-
18M.1.AHL.TZ1.H_9c:
Sketch the graph of showing clearly the position of the points A and B.
-
22M.2.SL.TZ2.4c.ii:
an appropriate range for .
-
22M.2.SL.TZ2.4c.i:
an appropriate domain for .
-
18M.2.AHL.TZ2.H_10c:
Sketch the graph of for t ≤ 0. Give the coordinates of any intercepts and the equations of any asymptotes.
-
19M.2.AHL.TZ2.H_4a:
Sketch the graphs and on the following axes for 0 < ≤ 9.

-
17M.1.AHL.TZ1.H_6a:
Sketch the graphs on the same set of axes.
-
18M.2.SL.TZ1.T_4e:
Sketch the graph of y = f (x) for 0 < x ≤ 6 and −30 ≤ y ≤ 60.
Clearly indicate the minimum point P and the x-intercepts on your graph. -
17N.2.AHL.TZ0.H_10d:
This region is now rotated through radians about the -axis. Find the volume of revolution.
-
18M.1.AHL.TZ2.H_10b.ii:
Sketch the graph of . State the equations of any asymptotes and the coordinates of any intercepts with the axes.
-
18M.2.AHL.TZ2.H_10d.ii:
Show that + β < −2.
-
17M.1.SL.TZ2.T_14b:
Use your graphic display calculator to find how long it will take for Jashanti to have saved enough money to buy the car.
-
22M.1.AHL.TZ2.10b:
Solve .
-
EXN.2.SL.TZ0.3b.ii:
Hence write down the domain of .
-
22M.1.SL.TZ1.11c:
Given , find the range for .
-
22M.1.SL.TZ1.3c:
State an appropriate domain for in this model.
-
21N.1.SL.TZ0.5a:
Find the range of .
-
18M.1.AHL.TZ2.H_2a:
Sketch the graphs of and on the following axes.

-
18N.1.AHL.TZ0.H_3b:
Write down the least value of such that has an inverse.
-
18N.1.AHL.TZ0.H_3a:
For , sketch the graph of . Indicate clearly the maximum and minimum values of the function.
-
17M.1.AHL.TZ1.H_6b:
Given that the graphs enclose a region of area 18 square units, find the value of b.
-
19M.2.SL.TZ1.S_9b:
Find u.
-
19M.2.SL.TZ2.T_5f:
Find the equation of the tangent line to the graph of at . Give the equation in the form where, , , and .
-
18M.2.SL.TZ1.T_4a:
Find the value of k.
-
17M.1.SL.TZ2.T_14a:
Write down the amount of money Jashanti saves per month.
-
18N.1.AHL.TZ0.H_3c.i:
For the value of found in part (b), write down the domain of .
-
19M.2.SL.TZ1.T_4b.ii:
State the domain of .
-
18M.2.SL.TZ2.T_6f:
Given that y = 2x3 − 9x2 + 12x + 2 = k has three solutions, find the possible values of k.
-
17N.1.SL.TZ0.S_5a:
Find .
-
19M.2.SL.TZ1.S_9d.iii:
Hence or otherwise, find the obtuse angle formed by the tangent line to at and the tangent line to at .
-
18M.2.SL.TZ2.T_6a:
Sketch the curve for −1 < x < 3 and −2 < y < 12.
-
19M.1.AHL.TZ1.H_8d:
Sketch the curve , 0 ≤ ≤ 5 indicating clearly the coordinates of the maximum and minimum points and any intercepts with the coordinate axes.
-
18M.2.AHL.TZ2.H_10a.ii:
With reference to your graph, explain why is a function on the given domain.
-
17M.2.AHL.TZ1.H_12e:
Find the inverse function and state its domain.
-
17M.1.AHL.TZ2.H_2c:
Write down the domain and range of .
-
16N.2.SL.TZ0.S_1b:
Find .
-
17M.1.AHL.TZ1.H_11a.ii:
Factorize .
-
18M.2.AHL.TZ2.H_10a.i:
Sketch the graph of for .
-
18M.2.SL.TZ2.T_6b:
A teacher asks her students to make some observations about the curve.
Three students responded.
Nadia said “The x-intercept of the curve is between −1 and zero”.
Rick said “The curve is decreasing when x < 1 ”.
Paula said “The gradient of the curve is less than zero between x = 1 and x = 2 ”.State the name of the student who made an incorrect observation.
-
19M.2.SL.TZ1.S_9d.i:
Find .
-
18N.1.AHL.TZ0.H_3c.ii:
For the value of found in part (b), find an expression for .
-
18M.2.SL.TZ1.T_4b:
Using your value of k , find f ′(x).
-
18M.1.AHL.TZ2.H_10b.i:
Express in the form where A, B are constants.
-
18M.2.AHL.TZ2.H_10a.iii:
Explain why has no inverse on the given domain.
-
19M.2.SL.TZ1.S_9c:
Find the acute angle between and .
-
17M.1.AHL.TZ1.H_11e:
Sketch the graph of .
-
17M.2.AHL.TZ1.H_12c:
Explain why is an even function.
-
17M.1.AHL.TZ2.H_2a:
Write down the range of .
-
16N.1.AHL.TZ0.H_3b:
find the value of .
-
18M.1.SL.TZ1.S_3c:
On the grid above, sketch the graph of f −1.
-
16N.2.AHL.TZ0.H_5b:
State the range of .
-
16N.1.SL.TZ0.T_9b:
Find the value of .
-
17M.2.SL.TZ2.S_6b:
On the following grid, sketch the graph of , for .
-
17M.1.AHL.TZ2.H_2b:
Find an expression for .
-
17M.1.AHL.TZ1.H_11d:
Hence find the value of if .
-
17N.2.AHL.TZ0.H_10a.i:
Show that the -coordinate of the minimum point on the curve satisfies the equation .
-
19M.1.AHL.TZ1.H_8a:
Write down the -coordinate of the point of inflexion on the graph of .
-
17M.1.SL.TZ2.T_14c:
Calculate how much extra money Jashanti needs.
-
19M.2.SL.TZ1.T_4e:
This straight road crosses the highway and then carries on due north.
State whether the straight road will ever cross the river. Justify your answer.
-
17M.2.AHL.TZ1.H_12g.ii:
Hence, show that there are no solutions to .
-
18M.1.AHL.TZ2.H_10c:
The function is defined by , for ≥ 0.
State the domain and range of .
-
17N.1.AHL.TZ0.H_6a:
Sketch the graph of , showing clearly any asymptotes and stating the coordinates of any points of intersection with the axes.
-
18M.1.AHL.TZ1.H_9b.i:
Show that there is exactly one point of inflexion, B, on the graph of .
-
18M.1.AHL.TZ2.H_2b:
Solve the equation .
-
18M.1.AHL.TZ1.H_9a:
The graph of has a local maximum at A. Find the coordinates of A.
-
17M.1.AHL.TZ1.H_11a.i:
Express in the form .
-
16N.1.AHL.TZ0.H_3a:
state the value of and the value of ;
-
17N.2.AHL.TZ0.H_10c:
Find the coordinates of the point on the graph of where the normal to the graph is parallel to the line .
-
17N.2.AHL.TZ0.H_10b:
Sketch the graph of showing clearly the minimum point and any asymptotic behaviour.
-
20N.1.SL.TZ0.T_2a.i:
State, in the context of the question, what the value of represents.
-
20N.1.SL.TZ0.T_2a.ii:
State, in the context of the question, what the value of represents.
-
20N.1.SL.TZ0.T_2c:
Kaelani has .
Find the maximum number of large cheese pizzas that Kaelani can order from Olava’s Pizza Company.
-
17N.2.AHL.TZ0.H_10a.ii:
Determine the values of for which is a decreasing function.
-
17M.1.AHL.TZ1.H_11c:
Show that .
-
20N.1.SL.TZ0.T_2b:
Write down the minimum number of pizzas that can be ordered.
-
17M.1.SL.TZ1.T_12a:
Write down the domain of the function.
-
16N.2.AHL.TZ0.H_5c:
Solve the inequality .
-
17M.2.AHL.TZ1.H_12f:
Find .
-
16N.2.SL.TZ0.S_1a:
Find .
-
17M.2.SL.TZ2.S_6c:
The equation has exactly two solutions, for . Find the possible values of .
-
EXN.2.SL.TZ0.3c:
Find the range of .
-
18M.2.SL.TZ2.T_6d:
Find .
-
18M.1.AHL.TZ1.H_9b.ii:
The coordinates of B can be expressed in the form B where a, b. Find the value of a and the value of b.
-
17M.2.AHL.TZ1.H_12d:
Explain why the inverse function does not exist.
-
17M.2.AHL.TZ1.H_12g.i:
Hence, show that there are no solutions to ;
-
17N.1.AHL.TZ0.H_6b:
Hence or otherwise, solve the inequality .
-
21M.1.SL.TZ1.4a:
Find the total cost of buying litres of gas at Leon’s gas station.
-
18M.2.SL.TZ1.T_4c:
Use your answer to part (b) to show that the minimum value of f(x) is −22 .
-
21M.1.SL.TZ1.4b:
Find .
-
18M.2.AHL.TZ2.H_10d.i:
Find and β in terms of .
-
19M.2.SL.TZ2.T_5d:
Find .
-
17M.1.SL.TZ1.T_12b.i:
Draw the line on the axes.
-
19M.2.SL.TZ1.T_4d:
Find the distance from the centre of Orangeton to the point at which the road meets the highway.
-
19M.1.AHL.TZ1.H_8b:
find the value of .
-
19N.1.SL.TZ0.T_10b:
While in Kota Kinabalu, Criselda spent . She returned to the Currency Exchange counter and changed the remainder of her into .
Calculate the amount of she received.
-
17M.2.SL.TZ2.S_6a:
Show that .
-
19M.2.AHL.TZ2.H_4b:
Hence solve in the range 0 < ≤ 9.
-
17N.1.SL.TZ0.S_5b:
Given that , find the value of .
-
16N.2.SL.TZ0.S_1c:
Solve .
-
18M.1.AHL.TZ2.H_10a:
Find the inverse function , stating its domain.
-
19M.2.SL.TZ1.S_9a:
Find the gradient of .
-
19N.1.SL.TZ0.T_10a:
Calculate the amount of that Criselda received.
-
19M.2.SL.TZ1.S_9d.ii:
Hence, write down .
-
18M.2.AHL.TZ2.H_10a.iv:
Explain why is not a function for .
-
16N.2.AHL.TZ0.H_5a:
Sketch the graph of indicating clearly any intercepts with the axes and the coordinates of any local maximum or minimum points.
-
17M.1.SL.TZ1.T_12c:
Find the range of values of for which has no solution.
-
17M.2.AHL.TZ1.H_12b:
Sketch the graph of showing clearly the equations of asymptotes and the coordinates of any intercepts with the axes.
-
17M.1.SL.TZ1.T_12b.ii:
Write down the number of solutions to .
-
21M.1.SL.TZ2.7b:
Find the value of .
-
21M.1.SL.TZ2.7a:
Find the range of .
-
21M.1.AHL.TZ2.2c:
Write down the range of .
-
17M.2.AHL.TZ1.H_12a:
Find the largest possible domain for to be a function.
-
19M.1.AHL.TZ1.H_8c:
find the value of .
-
21M.1.AHL.TZ2.2b:
Find an expression for the inverse function. The domain is not required.
-
21M.1.AHL.TZ2.2a:
Find the range of .
-
18M.2.AHL.TZ2.H_10b:
Show that .
-
17M.1.AHL.TZ1.H_11f:
Determine the area of the region enclosed between the graph of , the -axis and the lines with equations and .
-
17M.1.AHL.TZ1.H_11b:
Sketch the graph of , indicating on it the equations of the asymptotes, the coordinates of the -intercept and the local maximum.
-
19M.2.SL.TZ2.T_5e:
Find the gradient of the graph of at .
-
EXN.2.SL.TZ0.3b.i:
Find the value of at which the ball hits the ground.
-
EXN.2.SL.TZ0.3a:
Find an expression for the height of the ball at time .
-
21N.1.SL.TZ0.5b.i:
Find .
-
21N.1.SL.TZ0.5b.ii:
In the context of the question, interpret your answer to part (b)(i).
-
21N.1.SL.TZ0.5b.iii:
Write down the range of .