| Date | November 2014 | Marks available | 3 | Reference code | 14N.2.SL.TZ0.1 |
| Level | Standard level | Paper | Paper 2 | Time zone | Time zone 0 |
| Command term | Determine | Question number | 1 | Adapted from | N/A |
Question
Data analysis question.
A student sets up a circuit to study the variation of resistance \(R\) of a negative temperature coefficient (NTC) thermistor with temperature \(T\). The data are shown plotted on the graph.
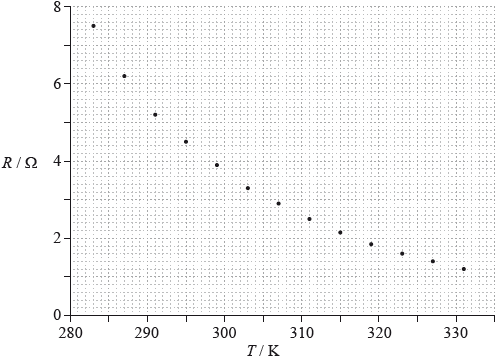
The electric current through the thermistor for \(T = 283{\text{ K}}\) is 0.78 mA. The uncertainty in the electric current is 0.01 mA.
Draw the best-fit line for the data points.
Calculate the gradient of the graph when \(T = 291{\text{ K}}\).
State the unit for your answer to (b)(i).
The uncertainty in the resistance value is 5%. The uncertainty in the temperature is negligible. On the graph, draw error bars for the data point at \(T = 283{\text{ K}}\) and for the data point at \(T = 319{\text{ K}}\).
Calculate the power dissipated by the thermistor at \(T = 283{\text{ K}}\).
Determine the uncertainty in the power dissipated by the thermistor at \(T = 283{\text{ K}}\).
Markscheme
smooth curve that passes within \( \pm 0.5\) squares of all data points;
a tangent drawn at \([291,{\text{ }}5.2]\) and selection of two extreme points on the tangent that use \(\Delta R > 3.5{\text{ }}\Omega \); } (judge by eye)
gradient magnitude determined as \(0.20 \pm 0.02\);
negative value given;
\(\Omega {\text{ }}{{\text{K}}^{ - 1}}\);
correct error bar for 283 K (total length of bar 3–5 squares, centred on point);
correct error bar for 319 K (total length of bar 0.5–2 squares, centred on point);
substituting \({I^2}R = \left( {{{[0.78 \times {{10}^{ - 3}}]}^2} \times 7.5} \right) = 4.5 \times {10^{ - 6}}{\text{ W}}\)\(\,\,\,\)or\(\,\,\,\)\(4.6 \times {10^{ - 6}}{\text{ W}}\);
fractional uncertainty in \({I^2} = 2 \times \frac{{0.01}}{{0.78}}\) (= 0.026\(\,\,\,\)or\(\,\,\,\)2.6%);
uncertainty in power \(\left( { = [0.026 + 0.05] \times 4.6 \times {{10}^{ - 6}}} \right) = 0.34 \times {10^{ - 6}}{\text{ W}}\) to \(0.35 \times {10^{ - 6}}{\text{ W}}\);
answer rounded to 1 significant figure;
or
uncertainty in \({I^2} = 2 \times 1.3\% /0.026\);
total uncertainty in \({\text{P}} = 7.6\% /0.076\);
answer rounded to 1 significant figure;
Examiners report
Very poorly executed. Few SL candidates knew how to draw an acceptable tangent.