| Date | November 2015 | Marks available | 1 | Reference code | 15N.2.SL.TZ0.1 |
| Level | Standard level | Paper | Paper 2 | Time zone | Time zone 0 |
| Command term | State | Question number | 1 | Adapted from | N/A |
Question
Data analysis question.
An experiment is undertaken to investigate the relationship between the temperature of a ball and the height of its first bounce.
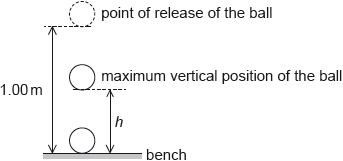
A ball is placed in a beaker of water until the ball and the water are at the same temperature. The ball is released from a height of 1.00 m above a bench. The maximum vertical height \(h\) from the bottom of the ball above the bench is measured for the first bounce. This procedure is repeated twice and an average \({h_{{\text{mean}}}}\) is calculated from the three measurements.

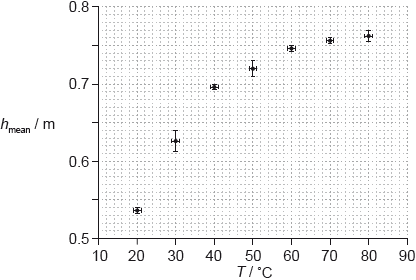
The procedure is repeated for a range of temperatures. The graph shows the variation of \({h_{{\text{mean}}}}\) with temperature \(T\).

Draw the line of best-fit for the data.
State why the line of best-fit suggests that \({h_{{\text{mean}}}}\) is not proportional to \(T\).
State the uncertainty in each value of \(T\).
The temperature is measured using a liquid in glass thermometer. State what physical characteristic of the thermometer suggests that the change in the liquid’s length is proportional to the change in temperature.
Another hypothesis is that \({h_{{\text{mean}}}} = K{T^3}\) where \(K\) is a constant. Using the graph on page 2, calculate the absolute uncertainty in \(K\) corresponding to \(T = 50{\rm{ ^\circ C}}\).
Markscheme
smooth curve line through all error bars;
Do not allow kinked or thick lines or double/multiple lines.
Ignore any line beyond the range of plotted points.
Assume a broken line is due to scan and allow BOD.
Line must go through vertical part of error bar. Do not allow line to clip horizontal endcaps.
line (of best-fit) not straight/curved/changing gradient;
ratio of \(h\) to \(T \times {10^{ - 4}}\) is not constant;
Allow “does not pass through origin” only if a straight line drawn in (a).
Otherwise treat as neutral.
(±)1° C/K/deg; (do not allow 2 or more sig figs in the answer)
equal graduations / constant cross-section/capillary diameter / (volume of) liquid expands linearly/proportionally to T / OWTTE;
Accept synonym for “capillary”, eg: “tube”.
\(\frac{{\Delta h}}{h} = \frac{{0.01}}{{0.72}}\) or 0.014 or 1.4% and \(\frac{{\Delta T}}{T} = \frac{1}{{50}}\) or 0.02 or 2%; (allow ECF from (c)(i))
\(\frac{{\Delta K}}{K} = 3 \times \frac{1}{{50}} + \frac{{0.01}}{{0.72}}\) or \( = 7.4 \times {10^{ - 2}}\) or 7.4%;
\(K = 5.8/5.76/6 \times {10^{ - 6}}\);
\(\Delta K = 4 \times {10^{ - 7}}{\text{ m}}\,{{\text{K}}^{ - 3}}\) or \({\rm{m ^\circ }}{{\text{C}}^{ - 3}}\); (1 sig fig and correct unit required)
Examiners report
Many candidates were able to draw acceptably smooth curves but sometimes these failed to stay within the region of the error bar “box”. Only a handful attempted to draw a straight line through the points. On the whole, the technical drawing of the lines was better than in previous years but there are still too many thick, doubled or kinked lines.
Many candidates stated that the line did not go through the origin. Although this answer was counted as neutral it showed that candidates were repeating by rote rather than applying their knowledge to the graph in question.
This was usually correct. The main error was to quote the answer to 2 or more significant figures.
This was poorly done. The question asks about a physical characteristic of the thermometer and proportionality. Answers often just repeated the question in other words.
There were many correct and well explained evaluations of the uncertainty in \(K\). However many candidates failed to link the magnitude of the percentage uncertainty with a sensible significant figure for the final answer. Only 1 significant figure was accepted by examiners following the large final percentage error in the answer. A unit for the answer was also required and this too was frequently omitted.

