| Date | November 2015 | Marks available | 2 | Reference code | 15N.2.HL.TZ0.1 |
| Level | Higher level | Paper | Paper 2 | Time zone | Time zone 0 |
| Command term | Suggest | Question number | 1 | Adapted from | N/A |
Question
Data analysis question.
An experiment is undertaken to investigate the relationship between the temperature of a ball and the height of its first bounce.
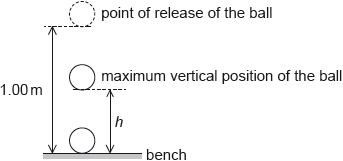
A ball is placed in a beaker of water until the ball and the water are at the same temperature. The ball is released from a height of 1.00 m above a bench. The maximum vertical height \(h\) from the bottom of the ball above the bench is measured for the first bounce. This procedure is repeated twice and an average \({h_{{\text{mean}}}}\) is calculated from the three measurements.
The procedure is repeated for a range of temperatures. The graph shows the variation of \({h_{{\text{mean}}}}\) with temperature \(T\).
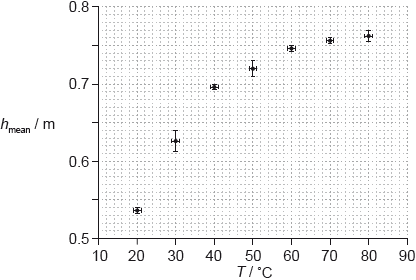
A student hypothesizes that \({h_{{\text{mean}}}}\) is proportional to \({T^2}\).
Comment, using two points on your line of best-fit, whether or not this is a valid hypothesis.
Suggest why using two points cannot confirm that \({h_{{\text{mean}}}}\) is proportional to \({T^2}\).
The temperature is measured using a liquid in glass thermometer. Explain why it is likely that the uncertainty in \(T\) is constant.
Markscheme
coordinates of two points on the line correctly read from the graph; } (check points read to within half a square and ignore omission of powers of ten in reading)
\(\frac{{{T^2}}}{h}\) or \(\frac{h}{{{T^2}}}\) calculated for both values;
consistent conclusion that values similar within the (typical) experimental error so sensible / differ outside (typical) experimental error so not sensible;} (must see reference to experimental error not just bald statement)
Award [2 max] for a graph of \({h_{{\text{mean}}}}\) versus \({T^2}\) and a conclusion that hypothesis is not valid.
Do not award credit for “does not go through origin”.
two points define a straight line / any arbitrary curve can pass through two points; to confirm hypothesis third point (or more) must lie on the straight line;
or
refers to experimental error in data (and therefore error in ratio) / depending on the two points chosen the hypothesis may be confirmed;
increasing the number of data points increases the strength of conclusion;
or
one of the two points chosen may be anomalous/erroneous/outlier;
third point needed to confirm hypothesis;
same thermometer used;
same eyes used;
same reading method used;
this type of thermometer has (typically) equal graduations;
liquid in thermometer expands linearly;
Examiners report
Many read two points correctly from the line, but too often examiners saw lines that missed a data point with the printed point still being used for the read-off. These derived data then generally led to a correct evaluation of \(\frac{h}{{{T^2}}}\) (or it’s reciprocal). However, for full marks, the examiners needed to see some consideration of the (sometimes considerable) error represented by the error bars and this was only rarely present.
There were a number of alternative statements that could gain credit here. The most frequently seen suggestion was that, because two points can define a line of any curvature, therefore a third (or more) data point is required to establish the proportionality.