| Date | May 2014 | Marks available | 3 | Reference code | 14M.2.SL.TZ2.1 |
| Level | Standard level | Paper | Paper 2 | Time zone | Time zone 2 |
| Command term | Calculate | Question number | 1 | Adapted from | N/A |
Question
Data analysis question.
An array of photovoltaic cells is used to provide electrical energy for a house. When the array produces more power than is consumed in the house, the excess power is fed back into the mains electrical supply for use by other consumers.
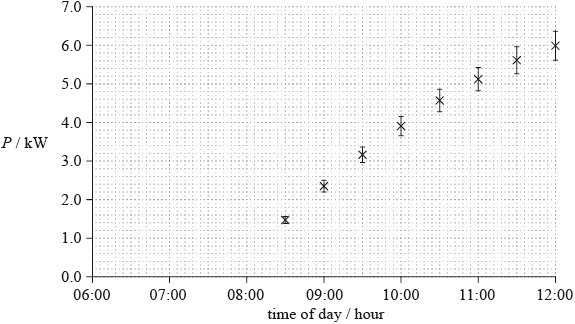
The graph shows how the power P produced by the array varies with the time of day. The error bars show the uncertainty in the power supplied. The uncertainty in the time is too small to be shown.

Using the graph, estimate the time of day at which the array begins to generate energy.
The average power consumed in the house between 08:00 and 12:00 is 2.0 kW. Determine the energy supplied by the array to the mains electrical supply between 08:00 and 12:00.
The power P produced by the array is calculated from the generated emf V and the fixed resistance R of the array using the equation \(\frac{{{V^2}}}{R}\). The uncertainty in the value of R is 2%. Calculate the percentage uncertainty in V at 12:00.
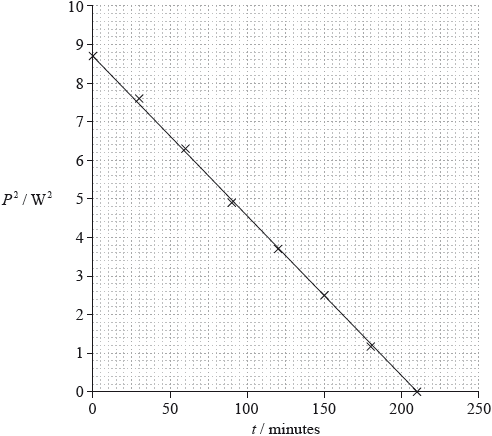
Later that day a second set of data was collected starting at \(t = 0\). The variation of \({P^2}\) with time \(t\) since the start of this second data collection is shown in the graph.

Using the graph, determine the relationship between \({P^2}\) and \(t\).
Markscheme
smooth curve drawn through all error bars and curve extrapolated appropriately to x-axis;
their own intercept correctly read to within ±6 minutes (1 small square) / 7:50 hour to 8:00 hour if no line drawn;
calculates total energy used by house = 8 (kWh) or 28.8 (MJ);
estimate of total area = 14 ± 1 (kWh) or 50.4 ± 3.6 (MJ);
6 ± 1 (kWh) or 21.6 ± 3.6 (MJ); (allow ECF from first two marking points)
or
clear attempt to estimate any area of graph;
correct calculation of area above 2 kW line on graph;
6 ± 1 (kWh) or 21.6 ± 3.6 (MJ); (allow ECF from first two marking points)
read-off error bar at 12:00 hour as 0.4;
calculate uncertainty in \(P = \left( {\frac{{100 \times 0.4}}{{6.0}} = } \right){\text{ 6.6% }}\);
\(\frac{{\Delta V}}{V} = \frac{{\left[ {\frac{{\Delta P}}{P} - \frac{{\Delta R}}{R}} \right]}}{2} = 2.3\% \);
intercept 8.7 ± 0.1;
gradient equals \(\left( {\frac{{8.7}}{{210}} = } \right){\text{ }}( - )0.041\); (allow ECF from first marking point)
\({P^2} = 8.7 - 0.041t\); } (negative sign essential) (allow ECF from first and second marking points)
Do not accept “inverse” relationship or “linear”.
Award [3] for a bald correct answer.
Award [2 max] if gradient is left as a fraction.
Examiners report
Most candidates understood the requirements of the question. They were able to draw an acceptably smooth curve extrapolated to the time axis. There were fewer poor quality lines than in previous examinations. Nevertheless, a substantial minority ended the curve at a time of 08:30 and then quoted this time as that at which the solar panels began to generate energy. Some drew a straight line (that could not possibly touch all the error bars) and extrapolated this line to a time of about 07:30. Some credit was available for this.
This was poorly done from two points of view. It was clear that there was widespread misunderstanding of the relationship between energy and power units. Many candidates could get no further forward than calculating the energy used by the house in the four-hour time period. Most were unable to recognise that the energy supplied to the grid was related to the area under the graph.
Candidates were usually able to read the error bar as having a total length of 0.8 units and could use this to calculate the uncertainty in P. Some were able to work through to the correct answer but many made a sign error in the calculation.
A number of past data-analysis questions have asked for a simple statement of the proportionality or otherwise of a provided graph. The use of the command verb “determine should have indicated to student that this question required more. The full relationship was required for full marks. For example, a determination of the gradient and the intercept (or solution from data points) to yield the equation relating \(P\) and \(t\) for the graph.

