| Date | May 2010 | Marks available | 4 | Reference code | 10M.2.sl.TZ2.2 |
| Level | SL | Paper | 2 | Time zone | TZ2 |
| Command term | Draw and Label | Question number | 2 | Adapted from | N/A |
Question
Draw and label an energy level diagram for the hydrogen atom. In your diagram show how the series of lines in the ultraviolet and visible regions of its emission spectrum are produced, clearly labelling each series.
Markscheme
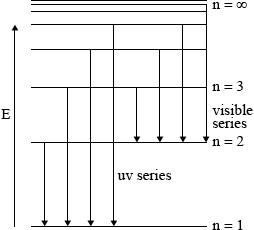
showing y-axis labelled as energy/E / labelling at least two energy levels;
showing a minimum of four energy levels/lines with convergence;
showing jumps to n = 1 for ultraviolet series;
showing jumps to n = 2 for visible light series;
Must show at least two vertical lines per series to score M3 and M4 but penalize once only.
For M3, M4 if transition not shown from higher to lower energy level penalize only once.
Examiners report
Although this generally proved to be the second most difficult question in Section A there were some excellent diagrams with some even linking a correct energy level diagram with a correct line emission spectrum. Candidates in some schools, however, appeared not to have encountered these ideas at all. Common errors were to label the first energy level as n = 0 rather than n = 1 and to only include one transition for each series. Sometimes the arrows showed the absorption rather than the required emission transition.