| Date | May 2017 | Marks available | 1 | Reference code | 17M.2.sl.TZ1.5 |
| Level | SL only | Paper | 2 | Time zone | TZ1 |
| Command term | Find | Question number | 5 | Adapted from | N/A |
Question
The table below shows the distribution of test grades for 50 IB students at Greendale School.

A student is chosen at random from these 50 students.
A second student is chosen at random from these 50 students.
The number of minutes that the 50 students spent preparing for the test was normally distributed with a mean of 105 minutes and a standard deviation of 20 minutes.
Calculate the mean test grade of the students;
Calculate the standard deviation.
Find the median test grade of the students.
Find the interquartile range.
Find the probability that this student scored a grade 5 or higher.
Given that the first student chosen at random scored a grade 5 or higher, find the probability that both students scored a grade 6.
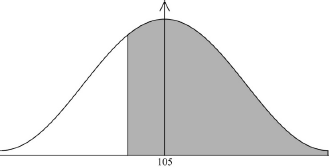
Calculate the probability that a student chosen at random spent at least 90 minutes preparing for the test.
Calculate the expected number of students that spent at least 90 minutes preparing for the test.
Markscheme
\(\frac{{1(1) + 3(2) + 7(3) + 13(4) + 11(5) + 10(6) + 5(7)}}{{50}} = \frac{{230}}{{50}}\) (M1)
Note: Award (M1) for correct substitution into mean formula.
\( = 4.6\) (A1) (G2)
[2 marks]
\(1.46{\text{ }}(1.45602 \ldots )\) (G1)
[1 mark]
5 (A1)
[1 mark]
\(6 - 4\) (M1)
Note: Award (M1) for 6 and 4 seen.
\( = 2\) (A1) (G2)
[2 marks]
\(\frac{{11 + 10 + 5}}{{50}}\) (M1)
Note: Award (M1) for \(11 + 10 + 5\) seen.
\( = \frac{{26}}{{50}}{\text{ }}\left( {\frac{{13}}{{25}},{\text{ }}0.52,{\text{ }}52\% } \right)\) (A1) (G2)
[2 marks]
\(\frac{{10}}{{{\text{their }}26}} \times \frac{9}{{49}}\) (M1)(M1)
Note: Award (M1) for \(\frac{{10}}{{{\text{their }}26}}\) seen, (M1) for multiplying their first probability by \(\frac{9}{{49}}\).
OR
\(\frac{{\frac{{10}}{{50}} \times \frac{9}{{49}}}}{{\frac{{26}}{{50}}}}\)
Note: Award (M1) for \({\frac{{10}}{{50}} \times \frac{9}{{49}}}\) seen, (M1) for dividing their first probability by \(\frac{{{\text{their }}26}}{{50}}\).
\( = \frac{{45}}{{637}}{\text{ (}}0.0706,{\text{ }}0.0706436 \ldots ,{\text{ }}7.06436 \ldots \% )\) (A1)(ft) (G3)
Note: Follow through from part (d).
[3 marks]
\({\text{P}}(X \geqslant 90)\) (M1)
OR
 (M1)
(M1)
Note: Award (M1) for a diagram showing the correct shaded region \(( > 0.5)\).
\(0.773{\text{ }}(0.773372 \ldots ){\text{ }}0.773{\text{ }}(0.773372 \ldots ,{\text{ }}77.3372 \ldots \% )\) (A1) (G2)
[2 marks]
\(0.773372 \ldots \times 50\) (M1)
\( = 38.7{\text{ }}(38.6686 \ldots )\) (A1)(ft) (G2)
Note: Follow through from part (f)(i).
[2 marks]

