| Date | May 2015 | Marks available | 2 | Reference code | 15M.2.sl.TZ2.4 |
| Level | SL only | Paper | 2 | Time zone | TZ2 |
| Command term | Find | Question number | 4 | Adapted from | N/A |
Question
Daniel grows apples and chooses at random a sample of 100 apples from his harvest.
He measures the diameters of the apples to the nearest cm. The following table shows the distribution of the diameters.
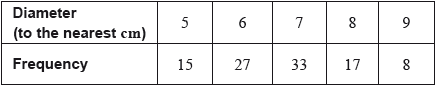
Using your graphic display calculator, write down the value of
(i) the mean of the diameters in this sample;
(ii) the standard deviation of the diameters in this sample.
Daniel assumes that the diameters of all of the apples from his harvest are normally distributed with a mean of 7 cm and a standard deviation of 1.2 cm. He classifies the apples according to their diameters as shown in the following table.
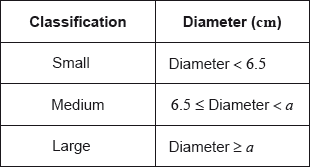
Calculate the percentage of small apples in Daniel’s harvest.
Daniel assumes that the diameters of all of the apples from his harvest are normally distributed with a mean of 7 cm and a standard deviation of 1.2 cm. He classifies the apples according to their diameters as shown in the following table.
Of the apples harvested, 5% are large apples.
Find the value of \(a\).
Daniel assumes that the diameters of all of the apples from his harvest are normally distributed with a mean of 7 cm and a standard deviation of 1.2 cm. He classifies the apples according to their diameters as shown in the following table.
Find the percentage of medium apples.
Daniel assumes that the diameters of all of the apples from his harvest are normally distributed with a mean of 7 cm and a standard deviation of 1.2 cm. He classifies the apples according to their diameters as shown in the following table.
This year, Daniel estimates that he will grow \({\text{100}}\,{\text{000}}\) apples.
Estimate the number of large apples that Daniel will grow this year.
Markscheme
(i) \(6.76{\text{ (cm)}}\) (G2)
Notes: Award (M1) for an attempt to use the formula for the mean with a least two rows from the table.
(ii) \(1.14{\text{ (cm)}}\;\;\;\left( {1.14122 \ldots {\text{ (cm)}}} \right)\) (G1)
\({\text{P}}({\text{diameter}} < 6.5) = 0.338\;\;\;(0.338461)\) (M1)(A1)
Notes: Award (M1) for attempting to use the normal distribution to find the probability or for correct region indicated on labelled diagram. Award (A1) for correct probability.
\(33.8(\% )\) (A1)(ft)(G3)
Notes: Award (A1)(ft) for converting their probability into a percentage.
\({\text{P}}({\text{diameter}} \geqslant a) = 0.05\) (M1)
Note: Award (M1) for attempting to use the normal distribution to find the probability or for correct region indicated on labelled diagram.
\(a = 8.97{\text{ (cm)}}\;\;\;(8.97382 \ldots )\) (A1)(G2)
\(100 - (5 + 33.8461 \ldots )\) (M1)
Note: Award (M1) for subtracting “\(5+\) their part (b)” from 100 or (M1) for attempting to use the normal distribution to find the probability \({\text{P}}\left( {6.5 \leqslant {\text{diameter}} < {\text{their part (c)}}} \right)\) or for correct region indicated on labelled diagram.
\( = 61.2(\% )\;\;\;\left( {61.1538 \ldots (\% )} \right)\) (A1)(ft)(G2)
Notes: Follow through from their answer to part (b). Percentage symbol is not required. Accept \(61.1(\%)\) (\(61.1209\ldots(\%)\)) if \(8.97\) used.
\(100\,000 \times 0.05\) (M1)
Note: Award (M1) for multiplying by \(0.05\) (or \(5\%\)).
\( = 5000\) (A1)(G2)