| Date | May 2009 | Marks available | 2 | Reference code | 09M.2.sl.TZ1.8 |
| Level | SL only | Paper | 2 | Time zone | TZ1 |
| Command term | Find | Question number | 8 | Adapted from | N/A |
Question
A fisherman catches 200 fish to sell. He measures the lengths, l cm of these fish, and the results are shown in the frequency table below.
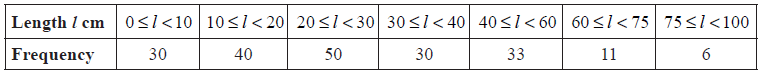
Calculate an estimate for the standard deviation of the lengths of the fish.
A cumulative frequency diagram is given below for the lengths of the fish.
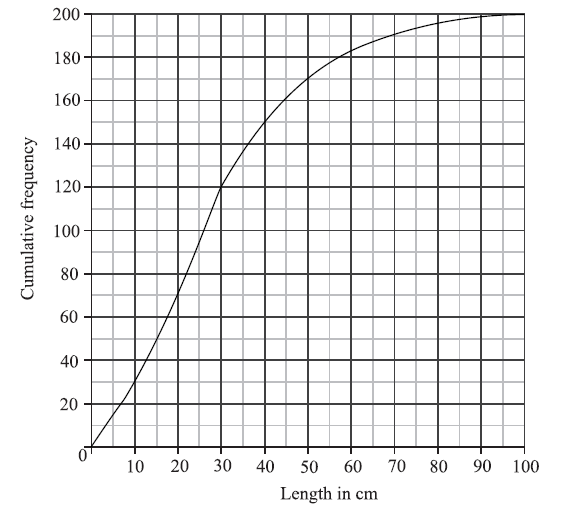
Use the graph to answer the following.
(i) Estimate the interquartile range.
(ii) Given that \(40\% \) of the fish have a length more than \(k{\text{ cm}}\), find the value of k.
In order to sell the fish, the fisherman classifies them as small, medium or large.
Small fish have a length less than \(20{\text{ cm}}\).
Medium fish have a length greater than or equal to \(20{\text{ cm}}\) but less than \(60{\text{ cm}}\).
Large fish have a length greater than or equal to \(60{\text{ cm}}\).
Write down the probability that a fish is small.
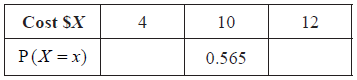
The cost of a small fish is \(\$ 4\), a medium fish \(\$ 10\), and a large fish \(\$ 12\).
Copy and complete the following table, which gives a probability distribution for the cost \(\$ X\) .
Find \({\text{E}}(X)\) .
Markscheme
evidence of using mid-interval values (5, 15, 25, 35, 50, 67.5, 87.5) (M1)
\(\sigma = 19.8\) (cm) A2 N3
[3 marks]
(i) \({Q_1} = 15\) , \({Q_3} = 40\) (A1)(A1)
\(IQR = 25\) (accept any notation that suggests the interval 15 to 40) A1 N3
(ii) METHOD 1
\(60\% \) have a length less than k (A1)
\(0.6 \times 200 = 120\) (A1)
\(k = 30\) (cm) A1 N2
METHOD 2
\(0.4 \times 200 = 80\) (A1)
\(200 - 80 = 120\) (A1)
\(k = 30\) (cm) A1 N2
[6 marks]
\(l < 20{\text{ cm}} \Rightarrow 70{\text{ fish}}\) (M1)
\({\rm{P(small)}} = \frac{{70}}{{200}}( = 0.35)\) A1 N2
[2 marks]
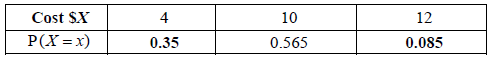 A1A1 N2
[2 marks]
correct substitution (of their p values) into formula for \({\text{E}}(X)\) (A1)
e.g. \(4 \times 0.35 + 10 \times 0.565 + 12 \times 0.085\)
\({\text{E}}(X) = 8.07\) (accept \(\$ 8.07\)) A1 N2
[2 marks]
Examiners report
Part (a) defeated the vast majority of candidates who clearly had not been taught data entry. Some schools had attempted to teach how to use a formula rather than the GDC to find the standard deviation and their students invariably used this formula incorrectly. Use of the GDC was not only expected but should be emphasized as stated in the syllabus.
Part (b) revealed poor understanding of cumulative frequency and the IQR was often reported as an interval.
This was generally answered well although a number of candidates had difficulty with using the formula for expected value.
This was generally answered well although a number of candidates had difficulty with using the formula for expected value.
This was generally answered well although a number of candidates had difficulty with using the formula for expected value.