| Date | May 2014 | Marks available | 4 | Reference code | 14M.1.sl.TZ2.6 |
| Level | SL only | Paper | 1 | Time zone | TZ2 |
| Command term | Sketch | Question number | 6 | Adapted from | N/A |
Question
The following diagram shows part of the graph of \(y = f(x)\).
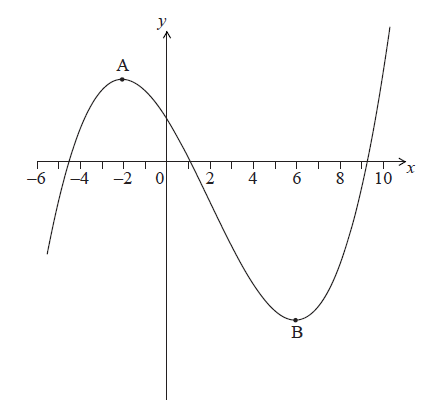
The graph has a local maximum at \(A\), where \(x = - 2\), and a local minimum at \(B\), where \(x = 6\).
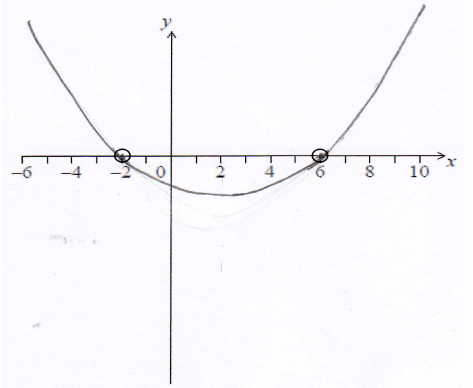
On the following axes, sketch the graph of \(y = f'(x)\).
[4]
a.
Write down the following in order from least to greatest: \(f(0),{\text{ }}f'(6),{\text{ }}f''( - 2)\).
[2]
b.
Markscheme
 A1A1A1A1 N4
Note: Award A1 for x-intercept in circle at \(-2\), A1 for x-intercept in circle at \(6\).
Award A1 for approximately correct shape.
Only if this A1 is awarded, award A1 for a negative y-intercept.
[4 marks]
a.
\(f''( - 2),{\text{ }}f'(6),{\text{ }}f(0)\) A2 N2
[2 marks]
b.
Examiners report
[N/A]
a.
[N/A]
b.