| Date | May 2017 | Marks available | 3 | Reference code | 17M.1.sl.TZ1.6 |
| Level | SL only | Paper | 1 | Time zone | TZ1 |
| Command term | Find | Question number | 6 | Adapted from | N/A |
Question
The following diagram shows the graph of \(f’\), the derivative of \(f\).
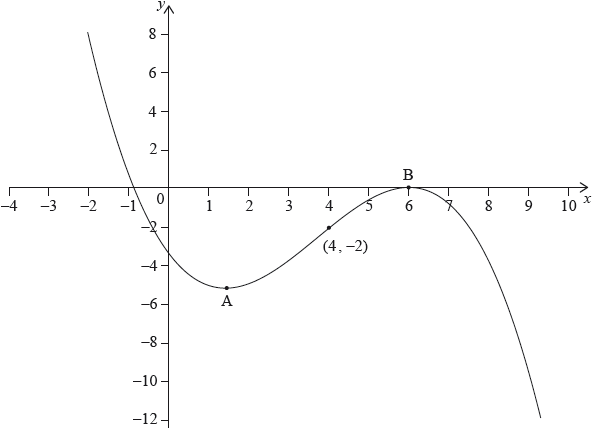
The graph of \(f’\) has a local minimum at A, a local maximum at B and passes through \((4,{\text{ }} - 2)\).
The point \({\text{P}}(4,{\text{ }}3)\) lies on the graph of the function, \(f\).
Write down the gradient of the curve of \(f\) at P.
Find the equation of the normal to the curve of \(f\) at P.
Determine the concavity of the graph of \(f\) when \(4 < x < 5\) and justify your answer.
Markscheme
\( - 2\) A1 N1
[1 mark]
gradient of normal \( = \frac{1}{2}\) (A1)
attempt to substitute their normal gradient and coordinates of P (in any order) (M1)
eg\(\,\,\,\,\,\)\(y - 4 = \frac{1}{2}(x - 3),{\text{ }}3 = \frac{1}{2}(4) + b,{\text{ }}b = 1\)
\(y - 3 = \frac{1}{2}(x - 4),{\text{ }}y = \frac{1}{2}x + 1,{\text{ }}x - 2y + 2 = 0\) A1 N3
[3 marks]
correct answer and valid reasoning A2 N2
answer: eg graph of \(f\) is concave up, concavity is positive (between \(4 < x < 5\))
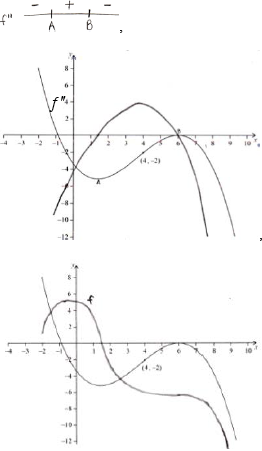
reason: eg slope of \(f’\) is positive, \(f’\) is increasing, \(f’’ > 0\),
sign chart (must clearly be for \(f’’\) and show A and B)
Note: The reason given must refer to a specific function/graph. Referring to “the graph” or “it” is not sufficient.
[2 marks]