| Date | May 2017 | Marks available | 2 | Reference code | 17M.1.sl.TZ1.4 |
| Level | SL only | Paper | 1 | Time zone | TZ1 |
| Command term | Predict | Question number | 4 | Adapted from | N/A |
Question
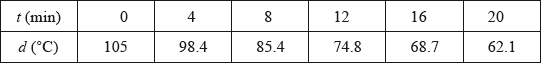
Jim heated a liquid until it boiled. He measured the temperature of the liquid as it cooled. The following table shows its temperature, \(d\) degrees Celsius, \(t\) minutes after it boiled.
Jim believes that the relationship between \(d\) and \(t\) can be modelled by a linear regression equation.
Write down the independent variable.
Write down the boiling temperature of the liquid.
Jim describes the correlation as very strong. Circle the value below which best represents the correlation coefficient.
\[0.992\quad \quad \quad 0.251\quad \quad \quad 0\quad \quad \quad - 0.251\quad \quad \quad - 0.992\]
Jim’s model is \(d = - 2.24t + 105\), for \(0 \leqslant t \leqslant 20\). Use his model to predict the decrease in temperature for any 2 minute interval.
Markscheme
\(t\) A1 N1
[1 mark]
105 A1 N1
[1 mark]
\( - 0.992\) A2 N2
[2 marks]
valid approach (M1)
eg\(\,\,\,\,\,\)\(\frac{{{\text{d}}d}}{{{\text{d}}t}} = - 2.24;{\text{ }}2 \times 2.24,{\text{ }}2 \times - 2.24,{\text{ }}d(2) = - 2 \times 2.24 \times 105,\)
finding \(d({t_2}) - d({t_1})\) where \({t_2} = {t_1} + 2\)
4.48 (degrees) A1 N2
Notes: Award no marks for answers that directly use the table to find the decrease in temperature for 2 minutes eg \(\frac{{105 - 98.4}}{2} = 3.3\).
[2 marks]