| Date | November 2014 | Marks available | 2 | Reference code | 14N.2.sl.TZ0.2 |
| Level | SL only | Paper | 2 | Time zone | TZ0 |
| Command term | Write down | Question number | 2 | Adapted from | N/A |
Question
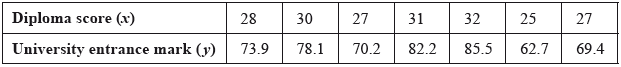
The following table shows the Diploma score \(x\) and university entrance mark \(y\) for seven IB Diploma students.
Find the correlation coefficient.
The relationship can be modelled by the regression line with equation \(y = ax + b\).
Write down the value of \(a\) and of \(b\).
Rita scored a total of \(26\) in her IB Diploma.
Use your regression line to estimate Rita’s university entrance mark.
Markscheme
evidence of set up (M1)
eg\(\;\;\;\)correct value for \(r\) (or for \(a\) or \(r\), seen in (b))
\(0.996010\)
\(r = 0.996\;\;\;[0.996,{\text{ }}0.997]\) A1 N2
[2 marks]
\(a = 3.15037,{\text{ }}b = - 15.4393\)
\(a = 3.15{\text{ }}[3.15,{\text{ }}3.16],{\text{ }}b = - 15.4{\text{ }}[ - 15.5,{\text{ }} - 15.4]\) A1A1 N2
[2 marks]
substituting \(26\) into their equation (M1)
eg\(\;\;\;\)\(y = 3.15(26) - 15.4\)
\(66.4704\)
\(66.5{\text{ }}[66.4,{\text{ }}66.5]\) A1 N2
[2 marks]
Total [6 marks]
Examiners report
Parts (b) and (c) of this question were correctly answered by most candidates.
However, a few students did not recognize that this question involved linear regression. And for those who did, not all of them knew what the correlation coefficient was. Some of them left this part of the question blank, and others wrote the value of \({r^2}\).
A number of students tried to find the values of \(a\) and \(b\) by forming two linear equations with two points from the table and solving them.