| Date | May 2022 | Marks available | 1 | Reference code | 22M.1.sl.TZ2.30 |
| Level | SL | Paper | 1 | Time zone | TZ2 |
| Command term | Interpret | Question number | 30 | Adapted from | N/A |
Question
20 cm3 of 1 mol dm−3 sulfuric acid was added dropwise to 20 cm3 of 1 mol dm−3 barium hydroxide producing a precipitate of barium sulfate.
H2SO4 (aq) + Ba(OH)2 (aq) → 2H2O (l) + BaSO4 (s)
Which graph represents a plot of conductivity against volume of acid added?

Markscheme
B
Examiners report
The question involved the formation of a precipitate – not a familiar concept to the candidates. It required candidates (to work out how the number of ions and hence conductivity were changing. 37% of the candidates got the correct answer (conductivity decreased as volume of H2SO4 increased). The majority increased conductivity as H2SO4 was added.
Syllabus sections
- 17N.2.hl.TZ0.1b: Determine the maximum temperature reached in each experiment by analysing the graph.
- 17N.2.hl.TZ0.1a: Using the graph, estimate the initial temperature of the solutions.
- 18M.1.sl.TZ2.30: The rate of a reaction is studied at different temperatures. Which is the best way to plot...
- 17N.2.sl.TZ0.1a: Using the graph, estimate the initial temperature of the solution.
- 17N.2.sl.TZ0.1b: Determine the maximum temperature reached in the experiment by analysing the graph.
- 17N.3.sl.TZ0.1b.i: Suggest what the correlation coefficient of −0.9999 indicates.
-
17M.3.sl.TZ1.3:
Suggest how the end point of the titration might be estimated from the graph.
-
22M.2.hl.TZ1.2c(i):
Use the graph to deduce the dependence of the reaction rate on the amount of Mg.
- 22M.1.sl.TZ2.3: Which graph represents the relationship between the amount of gas, n, and the absolute...
- 22M.1.sl.TZ2.17: A reaction has an activation energy of 40 kJ mol−1 and an enthalpy change of...
- 22M.1.hl.TZ2.20: Which energy profile diagram represents an exothermic SN1 reaction?
-
17M.3.hl.TZ1.16a:
Explain the shape of the curve at low oxygen partial pressure up to about 5 kPa.
-
17M.3.sl.TZ1.4:
State and explain how the graph would differ if 1 moldm−3 sulfuric acid had been used instead of 1 moldm−3 hydrochloric acid.
-
18M.2.hl.TZ1.4c:
Predict from your line of best fit the rate of reaction when the concentration of HCl is 1.00 mol dm−3.
-
18N.2.hl.TZ0.1c.ii:
Outline how the initial rate of reaction can be determined from the graph in part (c)(i).
-
18N.2.sl.TZ0.1c.ii:
Outline how the initial rate of reaction can be determined from the graph in part (c)(i).
-
18N.2.hl.TZ0.1c.i:
Sketch a graph of the concentration of iron(II) sulfate, FeSO4, against time as the reaction proceeds.

-
18N.2.hl.TZ0.6c:
Sketch the pH curve for the titration of 25.0 cm3 of ethylamine aqueous solution with 50.0 cm3 of butanoic acid aqueous solution of equal concentration. No calculations are required.

- 17M.1.hl.TZ1.23: The graph shows values of ΔG for a reaction at different temperatures. Which statement is...
-
18N.3.hl.TZ0.1b:
Deduce the equation for the relationship between absorbance and concentration.

-
18N.2.sl.TZ0.1c.i:
Sketch a graph of the concentration of iron(II) sulfate, FeSO4, against time as the reaction proceeds.
-
19M.1.hl.TZ1.39:
The dotted line represents the formation of oxygen, O2 (g), from the uncatalysed complete decomposition of hydrogen peroxide, H2O2 (aq).

Which curve represents a catalysed reaction under the same conditions?
-
19M.3.sl.TZ1.1b(i):
Describe the density trend across periods 4 and 5 of the periodic table.

-
19M.1.sl.TZ1.29:
The dotted line represents the formation of oxygen, O2(g), from the uncatalysed complete decomposition of hydrogen peroxide, H2O2 (aq).

Which curve represents a catalysed reaction under the same conditions?
-
19M.1.sl.TZ2.29:
Data collected from a larger number of silicon samples could also be plotted to determine the density using the following axes.

Which statements are correct?
I. The density is the slope of the graph.
II. The data will show that mass is proportional to volume.
III. The best-fit line should pass through the origin.A. I and II only
B. I and III only
C. II and III only
D. I, II and III
- 17N.3.sl.TZ0.1b.ii: State the equation of the straight line obtained using the data.
- 17M.1.sl.TZ2.30: What is the graphical relationship between n and T in the ideal gas equation, pV = nRT, all...
-
17M.3.hl.TZ1.16b.ii:
Outline the effect of decreasing pH on the oxygen saturation of hemoglobin.
-
17M.3.hl.TZ1.16b.i:
Sketch a graph on the axes above to show the effect of decreasing pH on the binding of oxygen to hemoglobin (the Bohr Effect).
-
19M.3.hl.TZ1.1b(i):
Describe the density trend across periods 4 and 5 of the periodic table.

- 17N.3.sl.TZ0.3a: Estimate the lowest freezing point of water that can be reached by adding sodium chloride.
- 17N.3.sl.TZ0.3b: Estimate the percentage by mass of NaCl dissolved in a saturated sodium chloride solution at...
- 19N.3.sl.TZ0.1a: Draw a best-fit line on the graph.
- 19N.3.hl.TZ0.14a: The graph shows the change in oxygen partial pressure in blood, measured at different pH...
-
17M.3.sl.TZ1.1a:
Calculate the percentage uncertainty of the volume of the aqueous sodium hydroxide.
-
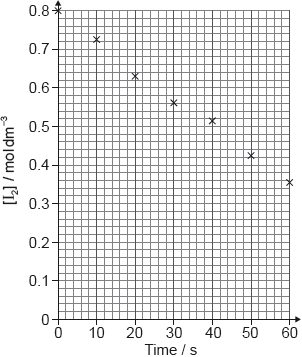
19M.2.sl.TZ1.4b(i):
In a laboratory experiment solutions of potassium iodide and hydrogen peroxide were mixed and the volume of oxygen generated was recorded. The volume was adjusted to 0 at t = 0.

The data for the first trial is given below.

Plot a graph on the axes below and from it determine the average rate of formation of oxygen gas in cm3 O2 (g) s−1.

Average rate of reaction:
-
18N.3.hl.TZ0.1e.i:
The original piece of brass weighed 0.200 g. The absorbance was 0.32.
Calculate, showing your working, the percentage of copper by mass in the brass.
-
18M.2.hl.TZ1.4b.ii:
Draw the best fit line for the reaction excluding point D.
- 19N.1.hl.TZ0.5: Which shows the first ionization energies of successive elements across period 2, from left...
- 21N.1.sl.TZ0.28: What is the slope of the graph? A. −0.0025 mol dm−3 s−1 B. −0.0025 mol dm−3 s C. ...
- 21N.1.sl.TZ0.29: Which graph shows the relationship between the pressure and volume of a sample of gas at...
-
18N.3.sl.TZ0.1b:
Deduce the equation for the relationship between absorbance and concentration.
-
17M.3.sl.TZ1.18a:
Dose response curves are determined for each drug.
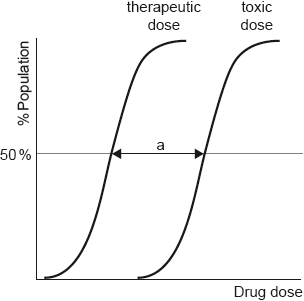
Outline the significance of range “a”.
-
18N.3.sl.TZ0.1d.i:
The original piece of brass weighed 0.200 g. The absorbance was 0.32.
Calculate, showing your working, the percentage of copper by mass in the brass.
- 21M.1.sl.TZ2.30: A liquid was added to a graduated cylinder. What can be deduced from the graph?
-
21M.2.sl.TZ1.6b(ii):
Deduce the relationship between the concentration of N2O5 and the rate of reaction.
-
17M.2.sl.TZ1.1a.ii:
A student produced these results with [H+] = 0.15 moldm−3. Propanone and acid were in excess and iodine was the limiting reagent.
Determine the relative rate of reaction when [H+] = 0.15 moldm−3.
-
19N.3.sl.TZ0.1b(i):
Determine the initial rate of reaction of limestone with nitric acid from the graph.
Show your working on the graph and include the units of the initial rate.
-
16N.3.sl.TZ0.1b:
CT values are influenced by temperature and by pH. The table below shows the CT values for chlorine needed to achieve 99% inactivation of a specific bacterium at stated values of pH and temperature.

(i) With reference to the temperature data in the table, suggest why it may be more difficult to treat water effectively with chlorine in cold climates.
(ii) Sketch a graph on the axes below to show how the CT value (at any temperature) varies with pH.

(iii) Comment on the relative CT values at pH 6.0 and pH 9.0 at each temperature.
(iv) Chlorine reacts with water as follows:
Cl2 (g) + H2O (l) HOCl (aq) + HCl (aq)
HOCl (aq) OCl− (aq) + H+ (aq)
Predict how the concentrations of each of the species HOCl (aq) and OCl− (aq) will change if the pH of the disinfected water increases.

-
19M.3.hl.TZ1.1b(iii):
Compare the ease of oxidation of s-block and d-block metals to their melting points and densities. Use section 25 of the data booklet.
-
19M.2.hl.TZ1.4b(i):
In a laboratory experiment solutions of potassium iodide and hydrogen peroxide were mixed and the volume of oxygen generated was recorded. The volume was adjusted to 0 at t = 0.
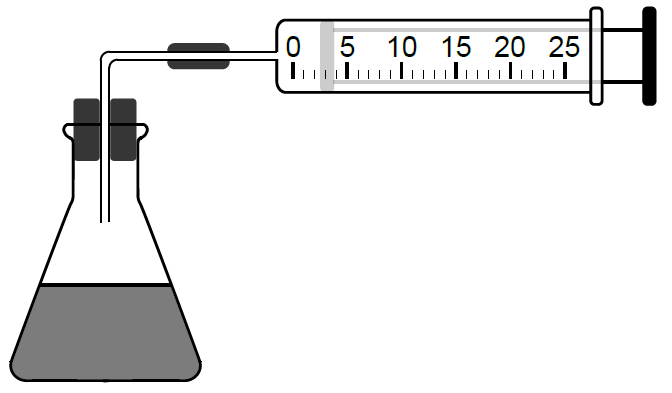
The data for the first trial is given below.
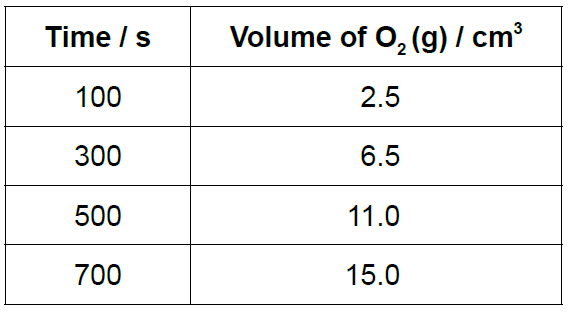
Plot a graph on the axes below and from it determine the average rate of
formation of oxygen gas in cm3 O2 (g) s−1.
Average rate of reaction:
-
17M.3.sl.TZ2.1a:
The following graph represents world energy consumption by type for the years 1988–2013.

Estimate the percentage of energy consumption which did not directly produce CO2 in 2013.
-
19M.3.sl.TZ1.1b(iii):
Compare the ease of oxidation of s-block and d-block metals to their melting points and densities. Use section 25 of the data booklet.
-
21N.1.hl.TZ0.23:
The graph shows Gibbs free energy of a mixture of N2O4 (g) and NO2 (g) in different proportions.
N2O4 (g) 2NO2 (g)
Which point shows the system at equilibrium?
