| Date | November 2019 | Marks available | 1 | Reference code | 19N.1.sl.TZ0.17 |
| Level | SL | Paper | 1 | Time zone | TZ0 |
| Command term | Determine | Question number | 17 | Adapted from | N/A |
Question
The dotted line represents the volume of carbon dioxide evolved when excess calcium carbonate is added to hydrochloric acid.
Which graph represents the production of carbon dioxide when excess calcium carbonate is added to the same volume of hydrochloric acid of double concentration?

Markscheme
D
Examiners report
Syllabus sections
-
18M.3.sl.TZ1.2c.ii:
State a factor, that has a significant effect on reaction rate, which could vary between marble chips of exactly the same mass.
- 18M.1.sl.TZ2.17: Which factors can affect the rate of reaction? I. Particle size of solid...
-
18M.1.sl.TZ2.16:
The potential energy profile for the reversible reaction, X + Y Z is shown.
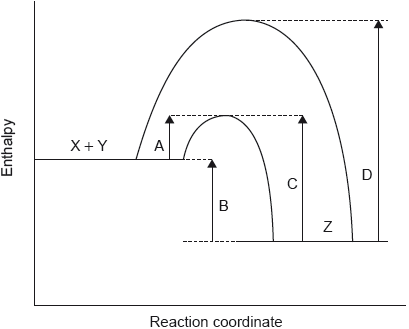
Which arrow represents the activation energy for the reverse reaction, Z → X + Y, with a catalyst?
- 17N.2.sl.TZ0.1e.i: Explain the shape of curve X in terms of the collision theory.
- 17N.1.sl.TZ0.16: The diagram shows the energy profile for a catalysed and uncatalysed reaction.Which...
-
18M.2.sl.TZ2.2b.i:
Sketch a curve on the graph to show the volume of gas produced over time if the same mass of crushed calcium carbonate is used instead of lumps. All other conditions remain constant.
- 22M.2.sl.TZ1.3f(ii): Outline the requirements for a collision between reactants to yield products.
-
18M.2.hl.TZ1.4a:
Outline two ways in which the progress of the reaction can be monitored. No practical details are required.
-
17M.2.sl.TZ1.1a.i:
Suggest how the change of iodine concentration could be followed.
-
18M.2.sl.TZ2.2a:
Sketch a Maxwell–Boltzmann distribution curve for a chemical reaction showing the activation energies with and without a catalyst.

- 22M.1.sl.TZ2.16: Why does a reaction for a sample of gases, at constant temperature, occur faster at higher...
- 22M.1.sl.TZ2.17: A reaction has an activation energy of 40 kJ mol−1 and an enthalpy change of...
- 22M.1.sl.TZ1.16: A sample of calcium carbonate reacts with excess hydrochloric acid in a beaker. The solid...
-
16N.2.sl.TZ0.3e:
A student decided to carry out another experiment using 0.075 mol dm-3 solution of sodium thiosulfate under the same conditions. Determine the time taken for the mark to be no longer visible.
-
17M.2.sl.TZ2.5a.ii:
Sketch, on the same graph, the expected results if the experiment were repeated using powdered magnesium, keeping its mass and all other variables unchanged.
- 19M.1.hl.TZ1.19: Which conditions are required for the reaction between two molecules? I. a collision ...
-
17M.1.sl.TZ2.16:
Which change does not increase the initial rate of reaction when CaCO3(s) is added to excess HCl(aq)?
A. Decrease in the size of the CaCO3(s) particles
B. Increase in the temperature of the reaction mixture
C. Increase in the concentration of HCl(aq), keeping the same volume
D. Increase in the volume of HCl(aq), keeping the same concentration
-
18M.2.hl.TZ1.4b.iii:
Suggest the relationship that points A, B and C show between the concentration of the acid and the rate of reaction.
-
18M.3.sl.TZ1.2b:
Neither method actually gives the initial rate. Outline a method that would allow the initial rate to be determined.
- 18M.1.sl.TZ1.17: Which statements are correct? I. The activation energy of a reaction is not...
-
18M.2.sl.TZ1.4b.ii:
Suggest the relationship that points A, B and C show between the concentration of the acid and the rate of reaction.
- 22M.2.hl.TZ2.4b: State two conditions necessary for a successful collision between reactants.
-
19M.3.hl.TZ2.1b(ii):
Examine, giving a reason, whether the rate of lead dissolving increases with acidity at 18 °C.
-
18N.1.sl.TZ0.16:
Samples of sodium carbonate powder were reacted with separate samples of excess hydrochloric acid.
Na2CO3 (s) + 2HCl (aq) → CO2 (g) + 2NaCl (aq) + H2O (l)
Reaction I: 1.0 g Na2CO3 (s) added to 0.50 mol dm−3 HCl (aq)
Reaction II: 1.0 g Na2CO3 (s) added to 2.0 mol dm−3 HCl (aq)
What is the same for reactions I and II?
A. Initial rate of reaction
B. Total mass of CO2 produced
C. Total reaction time
D. Average rate of production of CO2
- 18N.1.sl.TZ0.17: What decreases the activation energy of a reaction? A. Increasing the temperature B. ...
- 18N.2.hl.TZ0.1c.iii: Explain, using the collision theory, why replacing the iron powder with a piece of iron of...
-
18N.2.hl.TZ0.1c.ii:
Outline how the initial rate of reaction can be determined from the graph in part (c)(i).
-
18N.2.sl.TZ0.1c.ii:
Outline how the initial rate of reaction can be determined from the graph in part (c)(i).
-
18N.2.hl.TZ0.1c.i:
Sketch a graph of the concentration of iron(II) sulfate, FeSO4, against time as the reaction proceeds.

- 18N.2.sl.TZ0.1c.iii: Explain, using the collision theory, why replacing the iron powder with a piece of iron of...
-
21N.2.sl.TZ0.4b(i):
Sketch labelled Maxwell–Boltzmann energy distribution curves at the original temperature (T1) and the new lower temperature (T2).

- 21N.2.sl.TZ0.4a(iii): Suggest, with a reason, why 1-iodopentane reacts faster than 1-chloropentane under the same...
-
19M.2.hl.TZ1.4b(iii):
Additional experiments were carried out at an elevated temperature. On the axes below, sketch Maxwell–Boltzmann energy distribution curves at two temperatures T1 and T2, where T2 > T1.
-
18M.3.sl.TZ2.16c:
Explain why aspirin is not stored in a hot, humid location.
-
19M.2.hl.TZ2.2f:
The graph below shows the Maxwell–Boltzmann distribution of molecular energies at a particular temperature.
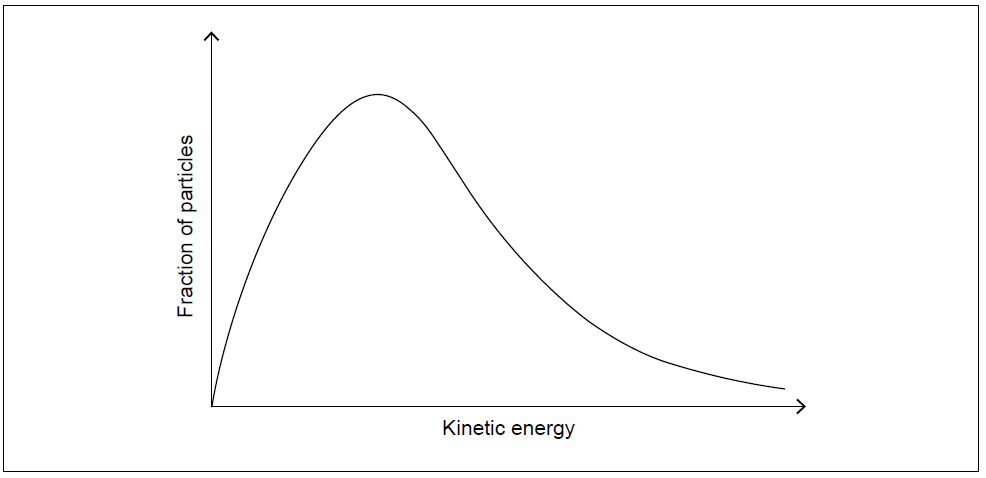
The rate at which dinitrogen monoxide decomposes is significantly increased by a metal oxide catalyst.
Annotate and use the graph to outline why a catalyst has this effect.
-
18N.2.sl.TZ0.1c.i:
Sketch a graph of the concentration of iron(II) sulfate, FeSO4, against time as the reaction proceeds.
-
19M.1.hl.TZ1.39:
The dotted line represents the formation of oxygen, O2 (g), from the uncatalysed complete decomposition of hydrogen peroxide, H2O2 (aq).

Which curve represents a catalysed reaction under the same conditions?
-
19M.1.hl.TZ2.19:
Several reactions of calcium carbonate with dilute hydrochloric acid are carried out at the same temperature.
CaCO3 (s) + 2HCl (aq) → CaCl2 (aq) + H2O (l) + CO2 (g)
Which reaction has the greatest rate?

- 19M.1.hl.TZ2.15: What is the activation energy of the reverse reaction?
- 19M.1.hl.TZ2.18: The same amount of two gases, X and Y, are in two identical containers at the same...
-
19M.2.sl.TZ1.4b(ii):
Additional experiments were carried out at an elevated temperature. On the axes below, sketch Maxwell–Boltzmann energy distribution curves at two temperatures T1 and T2, where T2 > T1.

-
18M.2.sl.TZ1.4a:
Outline two ways in which the progress of the reaction can be monitored. No practical details are required.
-
19M.2.sl.TZ2.2c:
The experiment is repeated using the same amount of dinitrogen monoxide in the same apparatus, but at a lower temperature.
Sketch, on the axes in question 2, the graph that you would expect.
- 19M.1.sl.TZ2.15: Which is the activation energy of the forward reaction?
- 19M.1.sl.TZ1.17: Which will increase the rate of reaction between calcium carbonate and hydrochloric acid? ...
-
19M.1.sl.TZ1.29:
The dotted line represents the formation of oxygen, O2(g), from the uncatalysed complete decomposition of hydrogen peroxide, H2O2 (aq).

Which curve represents a catalysed reaction under the same conditions?
- 19M.1.sl.TZ2.16: The same amount of two gases, X and Y, are in two identical containers at the same...
-
19M.1.sl.TZ2.17:
Several reactions of calcium carbonate with dilute hydrochloric acid are carried out at the same temperature.
CaCO3 (s) + 2HCl (aq) → CaCl2 (aq) + H2O (l) + CO2 (g)
Which reaction has the greatest rate?

-
18M.2.hl.TZ1.4b.i:
Suggest why point D is so far out of line assuming human error is not the cause.
-
17N.1.sl.TZ0.17:
Excess magnesium powder was added to a beaker containing hydrochloric acid, HCl (aq).
The mass of the beaker and its contents was recorded and plotted against time (line I).

Which change could give line II?
A. Doubling the mass of powdered Mg
B. Using the same mass of Mg ribbon
C. Increasing the temperature
D. Using the same volume of more concentrated HCl
-
22M.2.hl.TZ2.6a:
Outline, giving a reason, the effect of a catalyst on a reaction.
-
19M.3.hl.TZ2.1a:
Identify the experiment with the highest rate of lead dissolving.
- 21N.1.sl.TZ0.18: Which combination has the greatest rate of reaction at room temperature?
- 16N.1.sl.TZ0.16: For the reaction R → P, which letter represents the activation energy for the catalysed...
- 16N.2.sl.TZ0.3g: Suggest one reason why the values of rates of reactions obtained at higher temperatures may...
-
16N.1.sl.TZ0.17:
Which experimental methods could be used to observe the progress of the following reaction?
Cr2O72-(aq) + 6I-(aq) + 14H+(aq) → 2Cr3+(aq) + 3I2(aq) + 7H2O(l)
I. Change in colour
II. Change in mass
III. Change in electrical conductivityA. I and II only
B. I and III only
C. II and III only
D. I, II and III
-
19M.3.sl.TZ2.1a:
Identify the experiment with the highest rate of lead dissolving.
-
17M.1.sl.TZ1.16:
Copper catalyses the reaction between zinc and dilute sulfuric acid.
Zn(s) + H2SO4(aq) → ZnSO4(aq) + H2(g)
Why does copper affect the reaction?
A. Decreases the activation energy
B. Increases the activation energy
C. Increases the enthalpy change
D. Decreases the enthalpy change
- 17N.2.sl.TZ0.1e.ii: Suggest one possible reason for the differences between curves X and Y.
-
17N.3.sl.TZ0.2b:
Suggest two variables, besides the time of reaction, which the student should have controlled in the experiment to ensure a fair comparison of the antacids.
- 19N.3.sl.TZ0.1c(i): Justify this hypothesis.
-
19M.3.hl.TZ2.2b:
Outline, with a reason, another property that could be monitored to measure the rate of this reaction.
-
17M.1.sl.TZ1.17:
100 cm3 of 10% hydrogen peroxide solution decomposes at 298 K to form water and oxygen.
H2O2(aq) → H2O(l) + O2(g)
The dotted line graph represents the volume of oxygen produced.

Which graph represents the decomposition of an equal volume of a 20% solution under the same conditions?
-
19N.2.sl.TZ0.5a(iv):
Explain how the catalyst increases the rate of the reaction.
- 21M.2.hl.TZ1.6a: Suggest how the extent of decomposition could be measured.
- 21M.2.hl.TZ1.6b(i): Plot the missing point on the graph and draw the best-fit line.
-
17M.2.sl.TZ1.1b:
The student then carried out the experiment at other acid concentrations with all other conditions remaining unchanged.

State and explain the relationship between the rate of reaction and the concentration of acid.
-
16N.2.sl.TZ0.3d:
Draw the best fit line of against concentration of sodium thiosulfate on the axes provided.

-
17M.2.hl.TZ1.1b:
The student then carried out the experiment at other acid concentrations with all other conditions remaining unchanged.
Determine the relationship between the rate of reaction and the concentration of acid and the order of reaction with respect to hydrogen ions.

-
19M.2.hl.TZ2.2d:
The experiment is repeated using the same amount of dinitrogen monoxide in the same apparatus, but at a lower temperature.
Sketch, on the axes in question 2, the graph that you would expect.
-
19M.2.hl.TZ2.2b:
Outline, in terms of collision theory, how a decrease in pressure would affect the rate of reaction.
- 19N.1.sl.TZ0.18: The graph shows the Maxwell–Boltzmann energy distribution curve for a given gas at a certain...
-
19M.2.sl.TZ1.4b(iii):
Apart from a greater frequency of collisions, explain, by annotating your graphs in (b)(ii), why an increased temperature causes the rate of reaction to increase.
-
19M.3.sl.TZ2.2b:
Outline, with a reason, another property that could be monitored to measure the rate of this reaction.
-
19M.2.sl.TZ2.2b:
Outline, in terms of collision theory, how a decrease in pressure would affect the rate of reaction.
-
18M.3.sl.TZ1.2c.i:
Deduce, giving a reason, which of the two methods would be least affected by the chips not having exactly the same mass when used with the different concentrations of acid.
-
19N.2.hl.TZ0.6a(iv):
Explain how the catalyst increases the rate of the reaction.
-
17M.1.sl.TZ2.17:
Which methods can be used to monitor the progress of this reaction?
A. I and II only
B. I and III only
C. II and III only
D. I, II and III
- 22M.2.sl.TZ2.3b(i): On the axes, sketch Maxwell–Boltzmann energy distribution curves for the reacting species at...
-
20N.2.hl.TZ0.7a:
Nitrogen monoxide reacts with oxygen gas to form nitrogen dioxide.
The following experimental data was obtained.

Deduce the partial order of reaction with respect to nitrogen monoxide and oxygen.

-
20N.1.sl.TZ0.17:
Which arrow shows the activation energy of the uncatalysed forward reaction for this equilibrium?

-
19M.1.hl.TZ1.18:
Which properties can be monitored to determine the rate of the reaction?
Fe (s) + CuSO4 (aq) → Cu (s) + FeSO4 (aq)
I. change in volume
II. change in temperature
III. change in colourA. I and II only
B. I and III only
C. II and III only
D. I, II and III
- 21M.1.sl.TZ1.16: Curve 1 shows the mass change when marble chips are added to excess hydrochloric acid in an...
- 21M.1.sl.TZ1.17: On the following Maxwell-Boltzmann distribution, which letter represents activation...
-
19M.2.sl.TZ2.2e:
The graph below shows the Maxwell–Boltzmann distribution of molecular energies at a particular temperature.

The rate at which dinitrogen monoxide decomposes is significantly increased by a metal oxide catalyst.
Annotate and use the graph to outline why a catalyst has this effect.
-
19M.3.sl.TZ2.2a:
Determine from the graph the rate of reaction at 20 s, in cm3 s−1, showing your working.
-
21M.2.hl.TZ1.4a:
The diagram shows the Maxwell-Boltzmann curve for the uncatalyzed reaction.
Draw a distribution curve at a lower temperature (T2) and show on the diagram how the addition of a catalyst enables the reaction to take place more rapidly than at T1.

-
18M.1.sl.TZ1.16:
Which change increases the rate of formation of hydrogen when zinc reacts with excess hydrochloric acid, assuming all other conditions remain the same?
Zn(s) + 2HCl(aq) → ZnCl2(aq) + H2(g)
A. Adding water to the hydrochloric acid
B. Decreasing the temperature
C. Increasing the volume of hydrochloric acid
D. Decreasing the size of the zinc particles while keeping the total mass of zinc the same
- 21M.2.hl.TZ1.6b(ii): Outline why increasing the concentration of N2O5 increases the rate of reaction.
- 21M.2.sl.TZ2.1c(ii): Outline why a catalyst has such an effect.
-
18M.3.sl.TZ1.1b.i:
Suggest why there is a small increase in the surface pressure as the area is reduced to about 240 cm2, but a much faster increase when it is further reduced.

-
21M.1.sl.TZ2.16:
Which change causes the greatest increase in the initial rate of reaction between nitric acid and magnesium?
2HNO3 (aq) + Mg (s) → Mg(NO3)2 (aq) + H2 (g)

- 21M.1.sl.TZ2.17: The graph shows the Maxwell–Boltzmann energy distribution curve for a given gas at a certain...
-
17M.2.sl.TZ2.5a.i:
Outline why the rate of the reaction decreases with time.
- 21M.1.hl.TZ2.19: Which explains increasing rate of reaction with increasing temperature?
- 21M.1.hl.TZ2.21: Which statements are correct about the action of a catalyst in a chemical reaction? I. It...
-
19M.3.hl.TZ2.2a:
Determine from the graph the rate of reaction at 20 s, in cm3 s−1, showing your working.
-
19M.2.hl.TZ1.4b(iv):
Apart from a greater frequency of collisions, explain, by annotating your graphs in (b)(iii), why an increased temperature causes the rate of reaction to increase.
-
20N.2.sl.TZ0.4b:
Explain why an increase in temperature increases the rate of reaction.
-
19M.1.sl.TZ1.16:
Which properties can be monitored to determine the rate of the reaction?
Fe (s) + CuSO4 (aq) → Cu (s) + FeSO4 (aq)
I. change in volume
II. change in temperature
III. change in colourA. I and II only
B. I and III only
C. II and III only
D. I, II and III
-
21M.2.sl.TZ1.4a:
The diagram shows the Maxwell-Boltzmann curve for the uncatalyzed reaction.
Draw a distribution curve at a lower temperature (T2) and show on the diagram how the addition of a catalyst enables the reaction to take place more rapidly than at T1.
- 21M.2.sl.TZ1.6a: Suggest how the extent of decomposition could be measured.
- 21M.2.sl.TZ1.6b(i): Plot the missing point on the graph and draw the best-fit line.
- 21M.2.sl.TZ1.6b(iii): Outline why increasing the concentration of N2O5 increases the rate of reaction.
-
21M.2.sl.TZ1.6b(ii):
Deduce the relationship between the concentration of N2O5 and the rate of reaction.
-
20N.2.sl.TZ0.4a:
Outline how a catalyst increases the rate of reaction.
-
18M.2.sl.TZ1.4b.i:
Suggest why point D is so far out of line assuming human error is not the cause.
-
16N.2.sl.TZ0.3f:
An additional experiment was carried out at a higher temperature, T2.
(i) On the same axes, sketch Maxwell–Boltzmann energy distribution curves at the two temperatures T1 and T2, where T2 > T1.

(ii) Explain why a higher temperature causes the rate of reaction to increase.
-
22M.2.hl.TZ2.6b(i):
On the axes, sketch Maxwell–Boltzmann energy distribution curves for the reacting species at two temperatures T1 and T2, where T2 > T1.

- 21M.2.hl.TZ2.1b(v): State how adding a catalyst to the reaction would impact the enthalpy change of reaction, ΔH,...
-
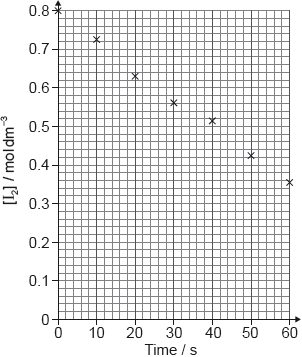
17M.2.sl.TZ1.1a.ii:
A student produced these results with [H+] = 0.15 moldm−3. Propanone and acid were in excess and iodine was the limiting reagent.
Determine the relative rate of reaction when [H+] = 0.15 moldm−3.
-
20N.1.sl.TZ0.16:
Which apparatus can be used to monitor the rate of this reaction?
- A pH meter
- A gas syringe
- A colorimeter
A. I and II only
B. I and III only
C. II and III only
D. I, II and III
-
19N.3.sl.TZ0.1b(i):
Determine the initial rate of reaction of limestone with nitric acid from the graph.
Show your working on the graph and include the units of the initial rate.
-
19M.3.sl.TZ2.2b(ii):
Examine, giving a reason, whether the rate of lead dissolving increases with acidity at 18 °C.
- 20N.2.hl.TZ0.4b: Explain why an increase in temperature increases the rate of reaction.
-
20N.2.hl.TZ0.4a:
Outline how a catalyst increases the rate of reaction.
- 20N.2.hl.TZ0.7b: Nitrogen monoxide reacts with oxygen gas to form nitrogen dioxide. Deduce, giving a reason,...
-
19N.3.sl.TZ0.1b(ii):
Explain why the rate of reaction of limestone with nitric acid decreases and reaches zero over the period of five days.
-
22M.2.sl.TZ2.3a:
Outline, giving a reason, the effect of a catalyst on a reaction.
-
20N.1.hl.TZ0.19:
Which change does not increase the rate of this reaction?
A. Increasing the particle size of the
B. Increasing the temperature
C. Increasing the concentration of
D. Stirring the reaction mixture
-
22M.1.sl.TZ1.17:
A student was investigating rates of reaction. In which of the following cases would a colorimeter show a change in absorbance?
A. KBr (aq) + Cl2 (aq)
B. Cu (s) + Na2SO4 (aq)
C. HCl (aq) + NaOH (aq)
D. (CH3)3COH (aq) + K2Cr2O7 (aq)
- 22M.2.hl.TZ1.5d(ii): Outline the requirements for a collision between reactants to yield products.
- 21N.2.sl.TZ0.4b(ii): Explain the effect of lowering the temperature on the rate of the reaction.
-
21N.1.sl.TZ0.17:
Which instrument would best monitor the rate of this reaction?
2KI (aq) + Cl2 (aq) → 2KCl (aq) + I2 (aq)
A. BalanceB. Colorimeter
C. Volumetric flask
D. Gas syringe