| Date | November 2019 | Marks available | 1 | Reference code | 19N.2.hl.TZ0.5 |
| Level | HL | Paper | 2 | Time zone | TZ0 |
| Command term | Identify | Question number | 5 | Adapted from | N/A |
Question
Another common acid found in food is ethanoic acid.
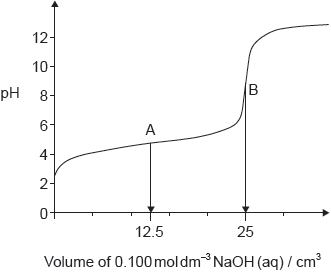
A sample of ethanoic acid was titrated with sodium hydroxide solution, and the following pH curve obtained.
Annotate the graph to show the buffer region and the volume of sodium hydroxide at the equivalence point.
Identify the most suitable indicator for the titration using section 22 of the data booklet.
Describe, using a suitable equation, how the buffer solution formed during the titration resists pH changes when a small amount of acid is added.
Markscheme
buffer region on graph ✔
equivalence point/Veq on graph ✔
NOTE: Construction lines not required.
phenolphthalein ✔
NOTE: Accept phenol red.
ALTERNATIVE 1:
H+ (aq) + CH3COO– (aq) → CH3COOH (aq) ✔
added acid neutralised by ethanoate ions
OR
«weak» CH3COOH (aq)/ethanoic acid replaces H+ (aq)
OR
CH3COOH/CH3COO– ratio virtually/mostly unchanged ✔
ALTERNATIVE 2:
CH3COOH (aq) H+ (aq) + CH3COO– (aq) ✔
equilibrium shifts to the ethanoic acid side
OR
CH3COOH/CH3COO− ratio virtually/mostly unchanged ✔


