| Date | May 2014 | Marks available | 1 | Reference code | 14M.1.hl.TZ1.21 |
| Level | HL | Paper | 1 | Time zone | TZ1 |
| Command term | Question number | 21 | Adapted from | N/A |
Question
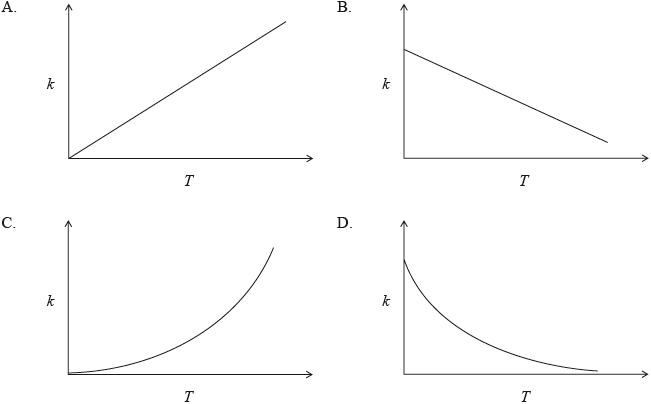
The rate constant for a reaction is determined at different temperatures. Which diagram represents the relationship between the rate constant, \(k\) , and temperature, \(T\) , in K ?

Markscheme
C
Examiners report
This question could be answered if students knew that the relationship between \(k\) and \(T\) is exponential (as stated in A.S. 16.3.1), but it was not necessary that students recalled the Arrhenius equation. Candidates found the question difficult, having only 46% correct answers.

