| Date | May 2015 | Marks available | 2 | Reference code | 15M.3.hl.TZ1.8 |
| Level | HL | Paper | 3 | Time zone | TZ1 |
| Command term | Sketch | Question number | 8 | Adapted from | N/A |
Question
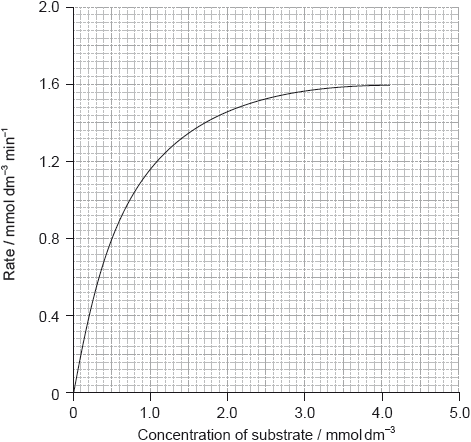
The graph below shows the effect of substrate concentration on the rate of an enzyme-catalysed reaction.

Outline the relationship between enzyme activity and concentration of the substrate.
Explain how competitive inhibition in an enzyme-catalysed reaction takes place.
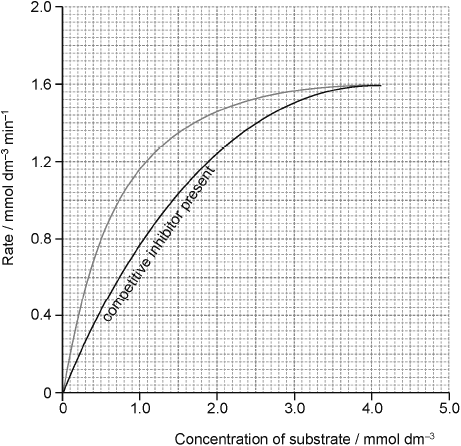
Sketch, on the graph on page 13, a curve which shows competitive inhibition occurring in this reaction.
Silver ions bond with sulfur atoms in an enzyme and change its tertiary structure and activity. Predict the effect of silver ions on the values of \({V_{{\text{max}}}}\) and \({K_{\text{m}}}\) of this enzyme.
\({V_{{\text{max}}}}\):
Km :
Markscheme
at low concentration, as [S] increases rate increases/is first order
OR
at low concentration more enzyme molecules can combine with substrate molecules as [S] increases;
at high concentration rate reaches a maximum/is zero order/is constant
OR
at high concentration (all) active sites used up/occupied;
Accept “at high concentration enzyme is saturated with substrate/saturation is reached”.
There must be a reference to low concentration to score M1 and to high concentration to score M2.
Award [1 max] for stating “as [S] increases rate increases” if no other mark scored.
Accept “(enzyme) activity” for “rate” throughout.
inhibitors have similar structure to the substrate;
they bind to/occupy/compete for the active sites;
fewer substrate molecules able to react / inhibitors blocks active site;

On the graph look for:
same maximum/\({V_{{\text{max}}}}\);
the curve is less steep (than without inhibition);
Award [1 max] if curve does not go through the origin.
\({V_{max}}\):
decreases;
\({K_m}\):
no change;
Examiners report
Overall this question was well answered. In (a) many did not refer to the areas of low and high concentration in the graph. (b) and (d) were very well answered. In (c), the most common mistake was candidates not drawing the second curve going to the same maximum.
Overall this question was well answered. In (a) many did not refer to the areas of low and high concentration in the graph. (b) and (d) were very well answered. In (c), the most common mistake was candidates not drawing the second curve going to the same maximum.
Overall this question was well answered. In (a) many did not refer to the areas of low and high concentration in the graph. (b) and (d) were very well answered. In (c), the most common mistake was candidates not drawing the second curve going to the same maximum.
Overall this question was well answered. In (a) many did not refer to the areas of low and high concentration in the graph. (b) and (d) were very well answered. In (c), the most common mistake was candidates not drawing the second curve going to the same maximum.

