| Date | May 2017 | Marks available | 1 | Reference code | 17M.3.hl.TZ2.13 |
| Level | HL | Paper | 3 | Time zone | TZ2 |
| Command term | Outline | Question number | 13 | Adapted from | N/A |
Question
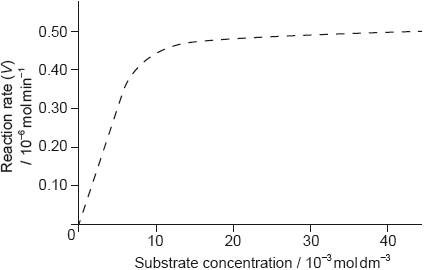
The graph of the rate of an enzyme-catalyzed reaction is shown below.

Determine the value of the Michaelis constant, Km, including units, from the graph.
Sketch a second graph on the same axes to show how the reaction rate varies when a competitive inhibitor is present.
Outline the significance of the value of Km.
Markscheme
«Km = [substrate] at \(\frac{1}{2}\) Vmax»
4.2 x 10⁻³
mol dm–3
Accept answers in the range of 3.5 x 10⁻³ to 5.0 x 10⁻³ mol dm–3.
M2 can be scored independently.
[2 marks]
graph to right of curve AND finish at same Vmax
Do not penalize if curve does not finish exactly at same Vmax as long as it is close to it (since drawn curve does not
flatten out completely at Vmax = 0.50).
[1 mark]
Km is inverse measure of affinity of enzyme for a substrate / Km is inversely proportional to enzyme activity
OR
high value of Km indicates higher substrate concentration needed for enzyme saturation
OR
low value of Km means reaction is fast at low substrate concentration
Idea of inverse relationship must be conveyed.
Accept “high value of Km indicates low affinity of enzyme for substrate/less stable ES complex/lower enzyme activity”.
Accept “low value of Km indicates high affinity of enzyme for substrate/stable ES complex/greater enzyme activity”.
[1 mark]

