| Date | November 2016 | Marks available | 3 | Reference code | 16N.2.AHL.TZ0.H_5 |
| Level | Additional Higher Level | Paper | Paper 2 | Time zone | Time zone 0 |
| Command term | Sketch | Question number | H_5 | Adapted from | N/A |
Question
Consider the function defined by where .
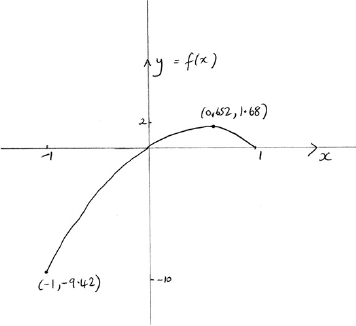
Sketch the graph of indicating clearly any intercepts with the axes and the coordinates of any local maximum or minimum points.
State the range of .
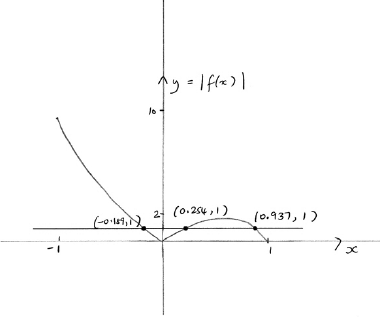
Solve the inequality .
Markscheme
* This question is from an exam for a previous syllabus, and may contain minor differences in marking or structure.

correct shape passing through the origin and correct domain A1
Note: Endpoint coordinates are not required. The domain can be indicated by and 1 marked on the axis.
A1
two correct intercepts (coordinates not required) A1
Note: A graph passing through the origin is sufficient for .
[3 marks]
A1A1
Note: Award A1A0 for open or semi-open intervals with correct endpoints. Award A1A0 for closed intervals with one correct endpoint.
[2 marks]
attempting to solve either (or equivalent) or (or equivalent) (eg. graphically) (M1)

(A1)
A1A1
Note: Award A0 for .
[4 marks]

