| Date | November 2018 | Marks available | 1 | Reference code | 18N.1.sl.TZ0.29 |
| Level | SL | Paper | 1 | Time zone | TZ0 |
| Command term | Question number | 29 | Adapted from | N/A |
Question
What is the ratio of areas under each signal in the 1H NMR spectrum of 2-methylbutane?
A. 6 : 1 : 2 : 3
B. 3 : 3 : 1 : 5
C. 6 : 1 : 5
D. 3 : 3 : 1 : 2 : 3
Markscheme
A
Examiners report
Syllabus sections
- 18M.1.sl.TZ1.29: What is the index of hydrogen deficiency, IHD, of 3-methylcyclohexene? A. 0 B. ...
- 18M.1.sl.TZ1.30: What is the ratio of the areas of the signals in the 1H NMR spectrum of pentan-3-ol? A. ...
-
18M.2.sl.TZ1.1i:
Predict the number of signals in the 1H NMR spectrum of urea.
- 18M.1.sl.TZ2.28: Which feature of a molecule does infrared spectrometry detect? A. molecular mass B. ...
-
18M.2.sl.TZ2.7c.i:
Deduce the molecular formula of the compound.
-
18M.3.sl.TZ2.7b:
Deduce the number of 1H NMR signals produced by the zwitterion form of alanine.
- 17N.3.hl.TZ0.22a.i: Both spectra show a peak at wavenumber 1700 cm–1. Identify the bond responsible for this peak.
-
22M.1.sl.TZ1.30:
What is the index of hydrogen deficiency (IHD) of this molecule?
Paracetamol (acetaminophen)
A. 3
B. 4
C. 5
D. 6
-
22M.1.sl.TZ1.29:
Which compound produces this mass spectrum?
[Spectral Database for Organic Compounds, SDBS. SDBS Compounds and Spectral Search. [graph] Available at:
https://sdbs.db.aist.go.jp [Accessed 3 January 2019].] - 16N.1.sl.TZ0.29: What is always correct about the molecular ion, M+, in a mass spectrum of a compound? A. The...
- 22M.1.sl.TZ2.28: How many signals are observed in the 1H NMR spectrum of this compound?A. 1 B. 2 C. 3 D. 4
-
22M.1.hl.TZ2.40:
Given equimolar concentrations, which substance would produce the strongest signal in a 1H NMR spectrum?
A. (CH3)3CHB. C6H6
C. C8H18
D. Si(CH3)4
-
17M.1.sl.TZ2.28:
Which information can be gained from an infrared (IR) spectrum?
A. Ionization energy of the most abundant element
B. Number of different elements in the compound
C. Bonds present in a molecule
D. Molecular formula of the compound
-
17M.1.hl.TZ1.40:
Which technique is used to determine the bond lengths and bond angles of a molecule?
A. X-ray crystallography
B. Infrared (IR) spectroscopy
C. Mass spectroscopy
D. 1H NMR spectroscopy
-
17M.1.sl.TZ2.29:
What can be deduced from the following 1HNMR spectrum?
A. There is only one hydrogen atom in the molecule.
B. There is only one hydrogen environment in the molecule.
C. The molecule is a hydrocarbon.
D. There is only one isotope in the element.
-
17M.3.hl.TZ1.25c:
Organic molecules can be characterized using infrared (IR) spectroscopy.
Compare and contrast the infrared peaks above 1500 cm−1 in pure samples of aspirin and salicylic acid using section 26 of the data booklet.
-
18M.2.sl.TZ1.1g:
The mass spectrum of urea is shown below.
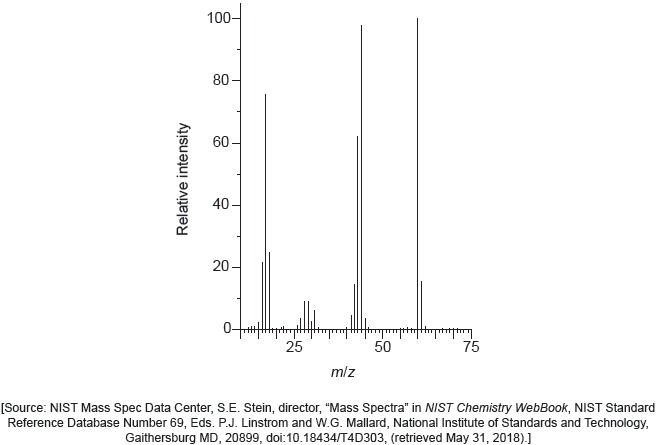
Identify the species responsible for the peaks at m/z = 60 and 44.
-
18M.2.sl.TZ2.7c.iii:
Deduce full structural formulas of two possible isomers of the unknown compound, both of which are esters.
-
18M.2.hl.TZ1.1l.i:
Predict the number of signals in the 1H NMR spectrum of urea.
-
18M.2.hl.TZ1.1k:
The IR spectrum of urea is shown below.
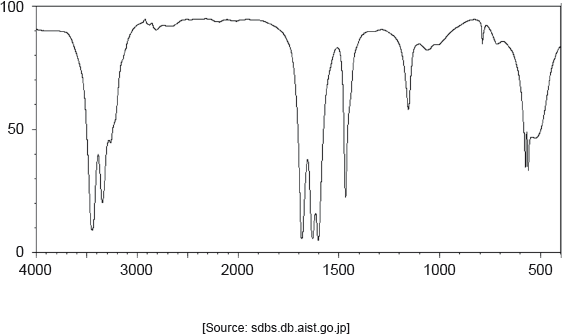
Identify the bonds causing the absorptions at 3450 cm−1 and 1700 cm−1 using section 26 of the data booklet.
- 21N.1.sl.TZ0.5: Consider the mass spectrum of an element: What is the relative atomic mass of this...
- 18N.1.sl.TZ0.28: Which is correct for the spectra of organic compounds? A. Mass spectroscopy provides...
- 18N.2.hl.TZ0.2c: The mass spectrum of the compound is shown. Deduce the relative molecular mass of the...
- 18N.2.hl.TZ0.2b: The infrared spectrum of the compound is shown. Deduce the functional group of the compound.
-
19M.1.hl.TZ2.39:
What can be deduced from the infrared (IR) spectrum of a compound?
A. Number of hydrogens
B. Number of hydrogen environments
C. Bonds present
D. Molar mass
-
17N.3.hl.TZ0.22a.ii:
Deduce which spectrum belongs to paracetamol, giving two reasons for your choice. Use section 26 of the data booklet.
-
19M.2.sl.TZ2.1c(v):
The IR spectrum and low resolution 1H NMR spectrum of the actual product formed are shown.
Deduce whether the product is A or B, using evidence from these spectra together with sections 26 and 27 of the data booklet.
Identity of product:
One piece of evidence from IR:
One piece of evidence from 1H NMR:
-
19M.3.hl.TZ2.5b:
The infrared (IR) spectrum of polyethene is given.
Suggest how the IR spectrum of polychloroethene would diff er, using section 26 of the data booklet.
-
17M.3.sl.TZ2.4:
Infrared (IR) spectra can be used to distinguish between various types of plastics. Some simplified IR spectra are given here.
Explain, with a reference to molecular structure, which two of the plastics can not be distinguished by IR spectroscopy.
-
19M.3.sl.TZ2.5b:
The infrared (IR) spectrum of polyethene is given.
Suggest how the IR spectrum of polychloroethene would differ, using section 26 of the data booklet.
-
19M.1.sl.TZ2.30:
What can be deduced from the infrared (IR) spectrum of a compound?
A. Number of hydrogens
B. Number of hydrogen environments
C. Bonds present
D. Molar mass
-
19M.1.sl.TZ1.30:
What is the degree of unsaturation (index of hydrogen deficiency) for the molecule?
A. 1
B. 2
C. 4
D. 5
-
17M.2.sl.TZ2.8c:
Identify the highest m/z value in the mass spectrum of quinone.
-
17N.1.sl.TZ0.29:
What information is provided by 1H NMR, MS and IR for an organic compound?
I. 1H NMR: chemical environment(s) of protons
II. MS: fragmentation pattern
III. IR: types of functional groupA. I and II only
B. I and III only
C. II and III only
D. I, II and III
-
17N.3.sl.TZ0.7b.ii:
One of the two infrared (IR) spectra is that of polyethene and the other of polytetrafluoroethene (PTFE).
Deduce, with a reason, which spectrum is that of PTFE. Infrared data is given in section 26 of the data booklet.
-
18M.2.sl.TZ2.7c.ii:
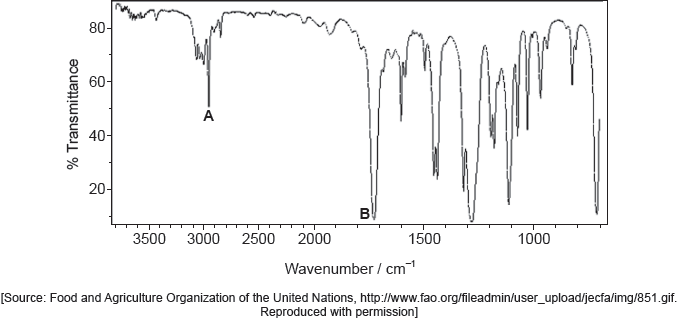
Identify the bonds causing peaks A and B in the IR spectrum of the unknown compound using section 26 of the data booklet.
-
19M.2.hl.TZ1.1a:
State the number of 1H NMR signals for this isomer of xylene and the ratio in which they appear.
-
17M.2.sl.TZ2.8b:
Identify the species responsible for the peak at m/z = 110 in the mass spectrum of hydroquinone.
-
17M.3.sl.TZ1.10a:
Below are the IR spectra of two plastics (A and B); one is PETE, the other is low density polyethene (LDPE).
Deduce, giving your reasons, the identity and resin identification code (RIC) of A and B using sections 26 and 30 of the data booklet.
-
16N.1.sl.TZ0.28:
What is the index of hydrogen deficiency (IHD) for this molecule?
A. 3
B. 4
C. 5
D. 6
-
17M.1.sl.TZ1.30:
What is the Index of Hydrogen Deficiency (IHD) for 1,3,5-hexatriene (C6H8)?
A. 1
B. 3
C. 5
D. 6
-
17M.3.hl.TZ2.21c.i:
Predict the number of different hydrogen environments in the molecule ignoring the benzene rings.
-
18M.2.hl.TZ1.1j:
The mass spectrum of urea is shown below.
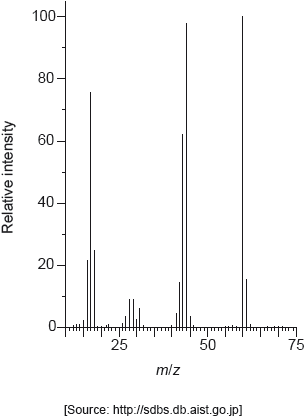
Identify the species responsible for the peaks at m/z = 60 and 44.
- 17N.2.sl.TZ0.6a.iii: Deduce the number of signals and the ratio of areas under the signals in the 1H NMR spectra...
-
19N.2.hl.TZ0.3d(iii):
Explain why the 1H NMR spectrum of C3H6O, produced in (d)(i), shows only one signal.
- 19N.3.sl.TZ0.12b(ii): The 1H NMR spectrum of one of the products has four signals. The integration trace shows a...
-
17M.1.sl.TZ1.28:
What can be determined about a molecule from the number of signals in its 1HNMR spectrum?
A. Bonds present
B. Molecular formula
C. Molecular mass
D. Number of hydrogen environments
-
17M.3.sl.TZ1.19d:
Organic molecules can be characterized using infrared (IR) spectroscopy.
Compare and contrast the infrared peaks above 1500 cm−1 in pure samples of aspirin and salicylic acid using section 26 of the data booklet.
-
19M.1.hl.TZ2.40:
Which technique involves breaking covalent bonds when carried out on an organic compound?
A. infrared spectroscopy
B. nuclear magnetic resonance spectroscopy
C. X-ray crystallography
D. mass spectrometry
-
21N.1.sl.TZ0.30:
What can be deduced from the mass spectrum of CH3COCH2CH2CH3?
NIST Mass Spectrometry Data Center Collection (C) 2021 copyright by the U.S. Secretary of Commerce on behalf of the United States of America. All rights reserved. 2-Pentanone Mass Spectrum, MS Number 291264. [graph] Available at: https://webbook.nist.gov/cgi/cbook.cgi?ID=C107879&Units=SI&Mask=200#Mass-Spec2-pentanone [Accessed 4 May 2020]. source adapted.
A. The molar mass is 43 g mol−1.B. The atoms have many isotopes.
C. The most likely bond to break is C–C between carbons 2 and 3.
D. The signal with the largest mass is due to the oxidation of the ketone in the spectrometer.
-
21N.2.hl.TZ0.1c:
Identify each compound from the spectra given, use absorptions from the range of 1700 cm−1 to 3500 cm−1. Explain the reason for your choice, referring to section 26 of the data booklet.
-
17M.2.hl.TZ2.7a.i:
Deduce what information can be obtained from the 1H NMR spectrum.
-
20N.1.sl.TZ0.29:
What is the index of hydrogen deficiency (IHD) in cyclohexanol?
A.
B.
C.
D.
-
19M.2.sl.TZ1.1a:
State the number of 1H NMR signals for this isomer of xylene and the ratio in which they appear.
Number of signals:
Ratio:
-
17M.2.hl.TZ2.7a.ii:
Identify the functional group that shows stretching at 1710 cm–1 in the infrared spectrum of this compound using section 26 of the data booklet and the 1H NMR.
- 20N.1.sl.TZ0.30: Which region of the electromagnetic spectrum is used to identify hydrogen environments in a...
-
18M.2.sl.TZ1.1h:
The IR spectrum of urea is shown below.
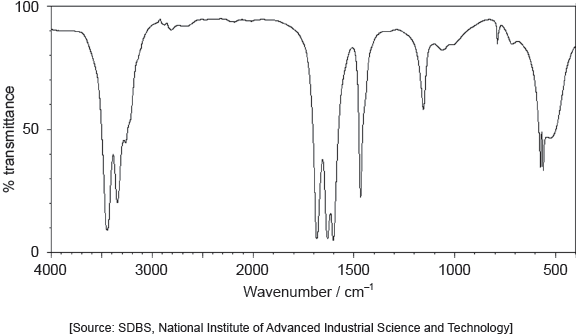
Identify the bonds causing the absorptions at 3450 cm−1 and 1700 cm−1 using section 26 of the data booklet.
-
20N.2.hl.TZ0.1d(v):
Deduce the number of signals and chemical shifts with splitting patterns in the 1H NMR spectrum of ethoxyethane. Use section 27 of the data booklet.
-
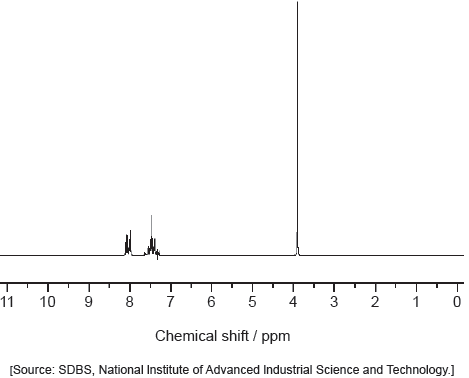
18M.2.sl.TZ2.7c.iv:
Deduce the formula of the unknown compound based on its 1H NMR spectrum using section 27 of the data booklet.
-
17M.3.hl.TZ2.20a.iii:
Suggest two absorbances, other than the absorbances due to the ring structure and C–H bonds, that would be present in the infrared (IR) spectrum of aspirin.
-
21M.1.sl.TZ1.30:
Determine the index of hydrogen deficiency (IHD) of paracetamol.
A. 3
B. 4
C. 5
D. 6
-
21N.2.sl.TZ0.1c:
Identify each compound from the spectra given, use absorptions from the range of 1700 cm−1 to 3500 cm−1. Explain the reason for your choice, referring to section 26 of the data booklet.
- 21M.2.hl.TZ1.5b(i): Justify why ethene has only a single signal in its 1H NMR spectrum.
-
21M.1.sl.TZ2.28:
Which spectra would show the difference between propan-2-ol, CH3CH(OH)CH3, and propanal, CH3CH2CHO?
I. mass
II. infrared
III. 1H NMRA. I and II only
B. I and III only
C. II and III only
D. I, II and III
-
17M.3.sl.TZ2.18a.ii:
Deduce the wavenumber of one absorbance seen in the IR spectrum of only one of the compounds, using section 26 of the data booklet.
- 21M.2.sl.TZ1.5b: Justify why ethene has only a single signal in its 1H NMR spectrum.
- 21M.2.sl.TZ2.4e(i): Deduce two features of this molecule that can be obtained from the mass spectrum. Use section...
-
21M.2.sl.TZ2.4e(iii):
Deduce the identity of the unknown compound using the previous information, the 1H NMR spectrum and section 27 of the data booklet.
SDBS, National Institute of Advanced Industrial Science and Technology (AIST).
- 21M.2.sl.TZ2.4e(ii): Identify the bond responsible for the absorption at A in the infrared spectrum. Use section...
-
21M.2.hl.TZ2.4g(iii):
Deduce the identity of the unknown compound using the previous information, the 1H NMR spectrum and section 27 of the data booklet.
SDBS, National Institute of Advanced Industrial Science and Technology (AIST).
- 21M.2.hl.TZ2.4g(i): Deduce two features of this molecule that can be obtained from the mass spectrum. Use section...
- 21M.2.hl.TZ2.4g(ii): Identify the bond responsible for the absorption at A in the infrared spectrum. Use section...
-
20N.2.hl.TZ0.2d:
The IR spectrum of one of the compounds is shown:
COBLENTZ SOCIETY. Collection © 2018 copyright by the U.S. Secretary of Commerce on behalf of the United States of America. All rights reserved.
Deduce, giving a reason, the compound producing this spectrum.
-
20N.2.sl.TZ0.2b:
The IR spectrum of one of the compounds is shown:
COBLENTZ SOCIETY. Collection © 2018 copyright by the U.S. Secretary of Commerce on behalf of the United States of America. All rights reserved.
Deduce, giving a reason, the compound producing this spectrum. -
20N.2.sl.TZ0.1d(vi):
Deduce the number of signals and their chemical shifts in the spectrum of ethoxyethane. Use section 27 of the data booklet.
-
22M.2.hl.TZ2.8d(iv):
Suggest two differences in the 1H NMR of but-2-ene and the organic product from (d)(ii).
-
22M.2.sl.TZ2.4d(iv):
Suggest two differences in the 1H NMR of but-2-ene and the organic product from (d)(ii).
-
17M.2.hl.TZ1.6c.ii:
The mass and 1H NMR spectra of product X are shown below. Deduce, giving your reasons, its structural formula and hence the name of the compound.
-
17M.2.sl.TZ1.5c.ii:
The mass and 1HNMR spectra of product X are shown below. Deduce, giving your reasons, its structural formula and hence the name of the compound.
- 21N.2.hl.TZ0.1e: Predict the fragment that is responsible for a m/z of 31 in the mass spectrum of propan‑1‑ol....

