| Date | November 2010 | Marks available | 1 | Reference code | 10N.1.sl.TZ0.4 |
| Level | SL | Paper | 1 | Time zone | TZ0 |
| Command term | Question number | 4 | Adapted from | N/A |
Question
The graph below represents the relationship between two variables in a fixed amount of gas.
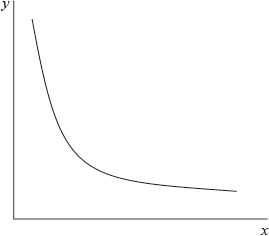
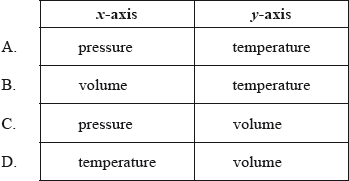
Which variables could be represented by each axis?
Markscheme
C
Examiners report
[N/A]
Syllabus sections
Show 39 related questions
- 17N.3.sl.TZ0.3b: Estimate the percentage by mass of NaCl dissolved in a saturated sodium chloride solution at...
- 17N.3.sl.TZ0.3a: Estimate the lowest freezing point of water that can be reached by adding sodium chloride.
- 17N.3.sl.TZ0.1b.ii: State the equation of the straight line obtained using the data.
- 17N.3.sl.TZ0.1b.i: Suggest what the correlation coefficient of −0.9999 indicates.
- 17N.2.sl.TZ0.1b: Determine the maximum temperature reached in the experiment by analysing the graph.
- 17N.2.sl.TZ0.1a: Using the graph, estimate the initial temperature of the solution.
- 17N.2.hl.TZ0.1b: Determine the maximum temperature reached in each experiment by analysing the graph.
- 17N.2.hl.TZ0.1a: Using the graph, estimate the initial temperature of the solutions.
- 17M.3.sl.TZ2.1a: The following graph represents world energy consumption by type for the...
- 17M.1.sl.TZ2.30: What is the graphical relationship between n and T in the ideal gas equation, pV = nRT, all...
- 17M.3.hl.TZ1.16b.ii: Outline the effect of decreasing pH on the oxygen saturation of hemoglobin.
- 17M.3.hl.TZ1.16b.i: Sketch a graph on the axes above to show the effect of decreasing pH on the binding of oxygen...
- 17M.3.hl.TZ1.16a: Explain the shape of the curve at low oxygen partial pressure up to about 5 kPa.
- 17M.3.sl.TZ1.18a: Dose response curves are determined for each drug. Outline the significance of range “a”.
- 17M.3.sl.TZ1.4: State and explain how the graph would differ if 1 mol\(\,\)dm−3 sulfuric acid had been used...
- 17M.3.sl.TZ1.3: Suggest how the end point of the titration might be estimated from the graph.
- 17M.3.sl.TZ1.1a: Calculate the percentage uncertainty of the volume of the aqueous sodium hydroxide.
- 17M.2.sl.TZ1.1a.ii: A student produced these results with [H+] = 0.15 mol\(\,\)dm−3. Propanone and acid were in...
- 17M.1.hl.TZ1.23: The graph shows values of ΔG for a reaction at different temperatures. Which statement is...
- 16N.3.sl.TZ0.1b: CT values are influenced by temperature and by pH. The table below shows the CT values for...
- 16M.3.sl.TZ0.1a: Using the graph, state, giving your reasons, whether or not oxygen and ozone are greenhouse...
- 16M.1.sl.TZ0.17: Graph 1 shows a plot of volume...
- 15M.2.sl.TZ2.1a.i: By drawing appropriate lines, determine the volume of hydrochloric acid required to...
- 14N.2.hl.TZ0.8e: (i) Draw a best-fit curve for the data on the graph. (ii) Use the data point...
- 14N.2.hl.TZ0.11a.i: Outline how the initial rate of reaction can be found from the graph.
- 14N.2.sl.TZ0.2a: Draw a best-fit curve for the data on the graph.
- 13N.2.hl.TZ0.1f.i: State the labels for each axis. x-axis: y-axis:
- 13N.2.hl.TZ0.1f.ii: Use the graph to determine the activation energy of the reaction, in...
- 13M.2.hl.TZ1.1f.ii: With reference to the graph on page 4, describe the effect of increasing temperature on the...
- 13M.2.hl.TZ1.3b: Use the graph on page 8 to determine the value of the activation energy, \({E_{\text{a}}}\),...
- 13M.2.hl.TZ1.3c: On the graph on page 8, sketch the line you would expect if a catalyst is added to the...
- 13M.2.hl.TZ2.2c: Determine the activation energy, \({E_{\text{a}}}\), correct to three significant figures and...
- 13M.2.sl.TZ2.2c: Sketch two Maxwell–Boltzmann energy distribution curves for a fixed amount of gas at two...
- 09N.2.hl.TZ0.6d: Consider the following graph of \(\ln k\) against \(\frac{1}{T}\) for the first order...
- 09N.2.sl.TZ0.5b: Graphing is an important method in the study of the rates of chemical reaction. Sketch a...
- 09M.2.sl.TZ2.7b.ii: The graph below shows the boiling points of the hydrides of group 5. Discuss the variation in...
- 11M.2.hl.TZ1.2a: State how the rate constant, \(k\) varies with temperature,\(T\).
- 11M.2.sl.TZ2.1a.ii: Determine what the temperature rise would have been, in °C, if no heat had been lost to the...
- 12M.1.sl.TZ2.30: The relationship between the pressure, \(P\), and the volume, \(V\), of a fixed amount of gas...