| Date | November 2016 | Marks available | 3 | Reference code | 16N.1.sl.TZ0.2 |
| Level | SL only | Paper | 1 | Time zone | TZ0 |
| Command term | Write down | Question number | 2 | Adapted from | N/A |
Question
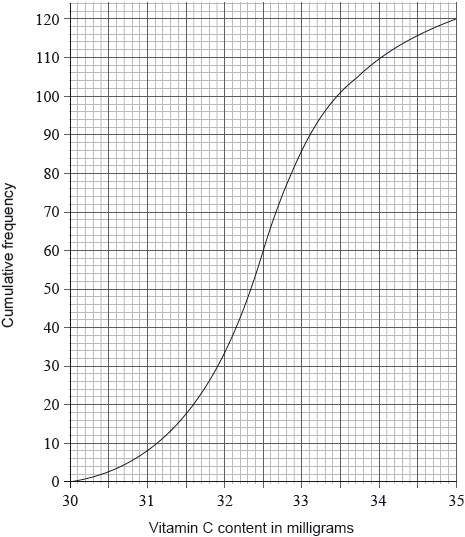
A sample of 120 oranges was tested for Vitamin C content. The cumulative frequency curve below represents the Vitamin C content, in milligrams, of these oranges.

The minimum level of Vitamin C content of an orange in the sample was 30.1 milligrams. The maximum level of Vitamin C content of an orange in the sample was 35.0 milligrams.
Giving your answer to one decimal place, write down the value of
(i) the median level of Vitamin C content of the oranges in the sample;
(ii) the lower quartile;
(iii) the upper quartile.
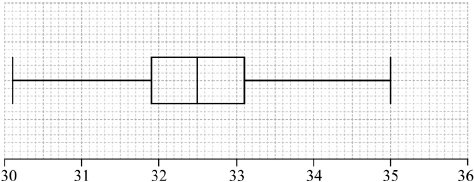
Draw a box-and-whisker diagram on the grid below to represent the Vitamin C content, in milligrams, for this sample.

Markscheme
(i) 32.5 (A1)
(ii) 31.9 (A1)
(iii) 33.1 (A1) (C3)
Note: Answers must be given correct to 1 decimal place.
[3 marks]

Note: Award (A1)(ft) for correct median, (A1)(ft) for correct quartiles and box, (A1) for correct end points of whiskers and straight whiskers.
Award at most (A1)(A1)(A0) if a horizontal line goes right through the box or if the whiskers are not well aligned with the midpoint of the box.
Follow through from part (a).
[3 marks]

