| Date | November 2013 | Marks available | 2 | Reference code | 13N.1.sl.TZ0.4 |
| Level | SL only | Paper | 1 | Time zone | TZ0 |
| Command term | Find | Question number | 4 | Adapted from | N/A |
Question
\(240\) cars were tested to see how far they travelled on \(10\) litres of fuel. The graph shows the cumulative frequency distribution of the results.
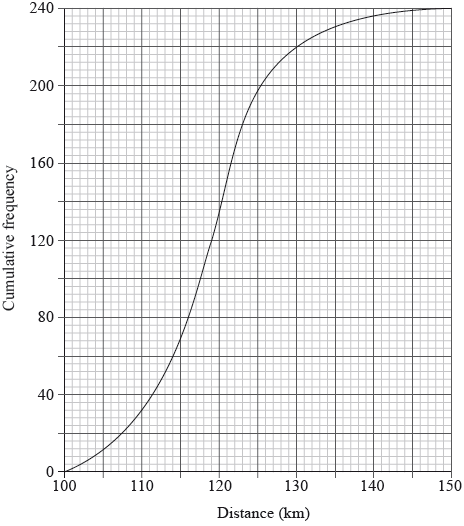
Find the median distance travelled by the cars.
Calculate the interquartile range of the distance travelled by the cars.
Find the number of cars that travelled more than \(130\) km.
Markscheme
\({{\text{Q}}_2} = 119{\text{ km}}\) (M1)(A1) (C2)
Note: Award (M1) for indication on graph of correct position of median.
[2 marks]
\({{\text{Q}}_1} = 114{\text{ and }}{{\text{Q}}_3} = 123\) (A1)
Note: Award (A1) for correct quartiles seen.
\(9\) (A1) (C2)
[2 marks]
\(240 - 220\) (M1)
Note: Award (M1) for \(220\) seen.
\( = 20\) (A1) (C2)
[2 marks]
Examiners report
Many candidates gained full marks on this question although a significant number could not find the interquartile range.
Many candidates gained full marks on this question although a significant number could not find the interquartile range.
Many candidates gained full marks on this question although a significant number could not find the interquartile range.