| Date | May 2014 | Marks available | 1 | Reference code | 14M.1.sl.TZ1.6 |
| Level | SL only | Paper | 1 | Time zone | TZ1 |
| Command term | Write down | Question number | 6 | Adapted from | N/A |
Question
The cumulative frequency graph represents the speed, s, in \({\text{km }}{{\text{h}}^{ - 1}}\), of 80 cars passing a speed camera.
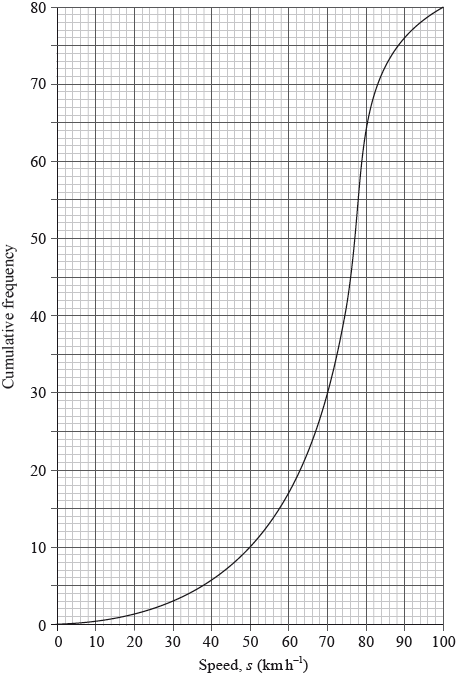
Write down the number of cars passing the camera with speed of less than or equal to 50 \({\text{km}}\,{{\text{h}}^{ - 1}}\).
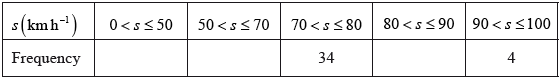
Complete the following grouped frequency table for \(s\), the speed of the cars passing the camera.
Write down the mid-interval value of the \(50 < s \leqslant 70\) interval.
Use your graphic display calculator to find an estimate of
(i) the mean speed of the cars passing the camera;
(ii) the standard deviation of the speed of the cars passing the camera.
Markscheme
10 (A1) (C1)
[1 mark]
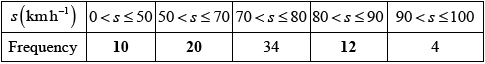 (A1)(ft) (C1)
Note: Follow through from their answer to part (a).
[1 mark]
60 (A1) (C1)
[1 mark]
(i) \(67.5 \left( {{\text{km}}\,{{\text{h}}^{ - 1}}} \right)\) (A2)(ft)
Notes: Award (M1) for an attempt to use the formula for the mean with at least two midpoint values consistent with their answer to part (c). Follow through from their table in part (b).
(ii) \(18.6 (18.6413…)\) (A1)(ft) (C3)
Note: Follow through from their table in part (b).
[3 marks]