| Date | May 2014 | Marks available | 4 | Reference code | 14M.2.sl.TZ2.3 |
| Level | SL only | Paper | 2 | Time zone | TZ2 |
| Command term | Estimate | Question number | 3 | Adapted from | N/A |
Question
A survey was conducted to determine the length of time, \(t\), in minutes, people took to drink their coffee in a café. The information is shown in the following grouped frequency table.
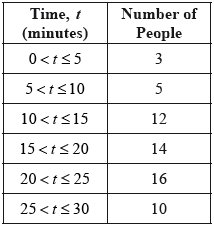
Write down the total number of people who were surveyed.
Write down the mid-interval value for the \(10 < t \leqslant 15\) group.
Find an estimate of the mean time people took to drink their coffee.
The information above has been rewritten as a cumulative frequency table.
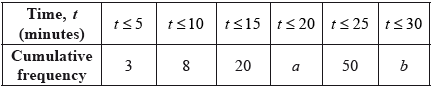
Write down the value of \(a\) and the value of \(b\).
This information is shown in the following cumulative frequency graph.
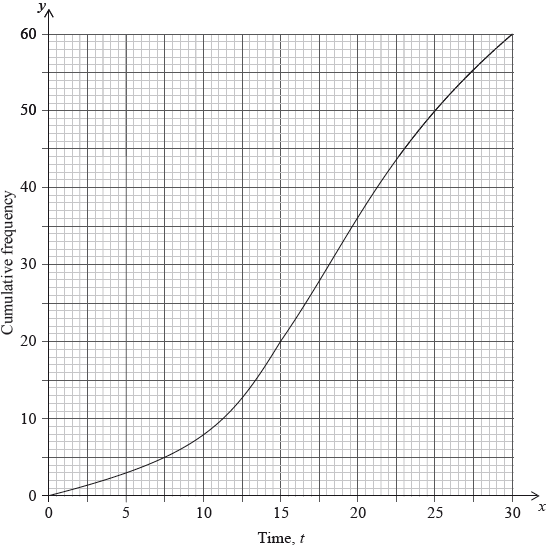
For the people who were surveyed, use the graph to estimate
(i) the time taken for the first \(40\) people to drink their coffee;
(ii) the number of people who take less than \(8\) minutes to drink their coffee;
(iii) the number of people who take more than \(23\) minutes to drink their coffee.
Markscheme
\(60\) (A1)
[1 mark]
\(12.5\) (A1)
[1 mark]
\(\frac{{3 \times 2.5 + 5 \times 7.5 + \ldots + 10 \times 27.5}}{{60}}\) (M1)
Note: Award (M1) for an attempt to substitute their mid-interval values (consistent with their answer to part (b)) into the formula for the mean.
Award (M1) where a table is constructed with their (consistent) mid-interval values listed along with the frequencies.
\( = \frac{{1075}}{{60}}{\text{ }}\left( {\frac{{215}}{{12}},{\text{ 17.9, 17.9166}} \ldots } \right)\) (A1)(ft)(G2)
Note: Follow through from their answer to part (b).
[2 marks]
\(a = 34,{\text{ }}b = 60\) (A1)(A1)
[2 marks]
(i) \( \leqslant {\text{21.25 minutes}}\) (A1)
Note: Accept \(21.25\).
Accept any answer between \(21\) and \(21.5\).
(Accept 21.5, but do not accept 21.)
(ii) \(5\) (A1)
Note: Accept \( < 6\). Do not accept \(6\).
Answer must be an integer.
(iii) \(60 - 45\) (M1)
\( = 15\) (A1)(G2)
Notes: Award (M1) for subtraction from \(60\). Accept \(15 \pm 1\).
Answer must be an integer.
[4 marks]