| Date | May 2015 | Marks available | 1 | Reference code | 15M.2.sl.TZ1.3 |
| Level | SL only | Paper | 2 | Time zone | TZ1 |
| Command term | Estimate | Question number | 3 | Adapted from | N/A |
Question
The cumulative frequency graph shows the speed, \(s\), in \({\text{km}}\,{{\text{h}}^{ - 1}}\), of \(120\) vehicles passing a hospital gate.
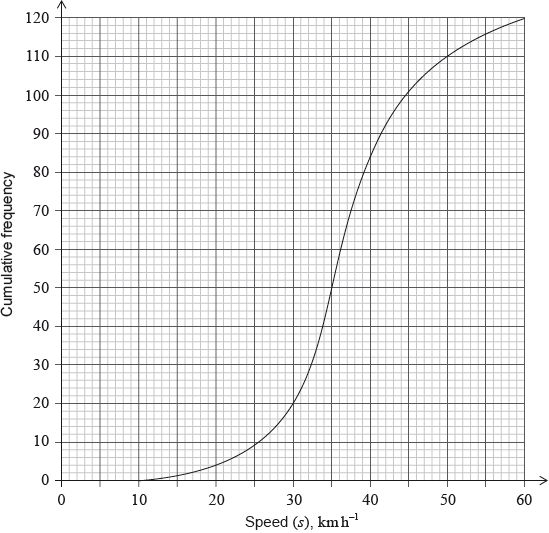
Estimate the minimum possible speed of one of these vehicles passing the hospital gate.
Find the median speed of the vehicles.
Write down the \({75^{{\text{th}}}}\) percentile.
Calculate the interquartile range.
The speed limit past the hospital gate is \(50{\text{ km}}\,{{\text{h}}^{ - 1}}\).
Find the number of these vehicles that exceed the speed limit.
The table shows the speeds of these vehicles travelling past the hospital gate.
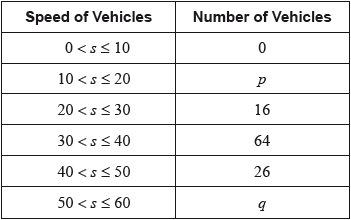
Find the value of \(p\) and of \(q\).
The table shows the speeds of these vehicles travelling past the hospital gate.
(i) Write down the modal class.
(ii) Write down the mid-interval value for this class.
The table shows the speeds of these vehicles travelling past the hospital gate.
Use your graphic display calculator to calculate an estimate of
(i) the mean speed of these vehicles;
(ii) the standard deviation.
It is proposed that the speed limit past the hospital gate is reduced to \(40{\text{ km}}\,{{\text{h}}^{ - 1}}\) from the current \(50{\text{ km}}\,{{\text{h}}^{ - 1}}\).
Find the percentage of these vehicles passing the hospital gate that do not exceed the current speed limit but would exceed the new speed limit.
Markscheme
\(10{\text{ (km}}\,{{\text{h}}^{ - 1}})\) (A1)
\(36\) (G2)
\(41.5\) (G1)
\(41.5 - 32.5\) (M1)
\( = 9{\text{ (}} \pm {\text{1)}}\) (A1)(ft)(G2)
Notes: Award (M1) for quartiles seen. Follow through from part (c).
\(120 - 110\) (M1)
\( = 10\) (A1)(G2)
Note: Award (M1) for \(110\) seen.
\(p = 4\;\;\;q = 10\) (A1)(ft)(A1)(ft)
Note: Follow through from part (e).
(i) \(30 < s \leqslant 40\) (A1)
(ii) \(35\) (A1)(ft)
Note: Follow through from part (g)(i).
(i) \(36.8{\text{ (km}}\,{{\text{h}}^{ - 1}})\;\;\;(36.8333)\) (G2)(ft)
Notes: Follow through from part (f).
(ii) \(8.85\;\;\;(8.84904 \ldots )\) (G1)(ft)
Note: Follow through from part (f), irrespective of working seen.
\(\frac{{26}}{{120}} \times 100\) (M1)
Note: Award (M1) for \(\frac{{26}}{{120}} \times 100\) seen.
\( = 21.7{\text{ (}}\% )\;\;\;\left( {21.6666 \ldots ,{\text{ }}21\frac{2}{3},{\text{ }}\frac{{65}}{3}} \right)\) (A1)(G2)
Examiners report
For the great majority, this was a straightforward and accessible question. There were many, however, who had no appreciation of medians, percentiles and quartiles – all straightforward concepts. Most were able to read from the graph, using correctly the scales; only the weakest misinterpreting these. Calculation of the mean and standard deviation are expected to be completed using the graphic display calculator (GDC) – formulae are no longer required and the covariance will not be given in questions. Many candidates, however, were unable to calculate the mean and standard deviation of a (grouped) frequency distribution, instead treating the data as raw; comments on the G2 forms from schools indicated that some teachers were also unable to do this and advice must be sought.
For the great majority, this was a straightforward and accessible question. There were many, however, who had no appreciation of medians, percentiles and quartiles – all straightforward concepts. Most were able to read from the graph, using correctly the scales; only the weakest misinterpreting these. Calculation of the mean and standard deviation are expected to be completed using the graphic display calculator (GDC) – formulae are no longer required and the covariance will not be given in questions. Many candidates, however, were unable to calculate the mean and standard deviation of a (grouped) frequency distribution, instead treating the data as raw; comments on the G2 forms from schools indicated that some teachers were also unable to do this and advice must be sought.
For the great majority, this was a straightforward and accessible question. There were many, however, who had no appreciation of medians, percentiles and quartiles – all straightforward concepts. Most were able to read from the graph, using correctly the scales; only the weakest misinterpreting these. Calculation of the mean and standard deviation are expected to be completed using the graphic display calculator (GDC) – formulae are no longer required and the covariance will not be given in questions. Many candidates, however, were unable to calculate the mean and standard deviation of a (grouped) frequency distribution, instead treating the data as raw; comments on the G2 forms from schools indicated that some teachers were also unable to do this and advice must be sought.
For the great majority, this was a straightforward and accessible question. There were many, however, who had no appreciation of medians, percentiles and quartiles – all straightforward concepts. Most were able to read from the graph, using correctly the scales; only the weakest misinterpreting these. Calculation of the mean and standard deviation are expected to be completed using the graphic display calculator (GDC) – formulae are no longer required and the covariance will not be given in questions. Many candidates, however, were unable to calculate the mean and standard deviation of a (grouped) frequency distribution, instead treating the data as raw; comments on the G2 forms from schools indicated that some teachers were also unable to do this and advice must be sought.
For the great majority, this was a straightforward and accessible question. There were many, however, who had no appreciation of medians, percentiles and quartiles – all straightforward concepts. Most were able to read from the graph, using correctly the scales; only the weakest misinterpreting these. Calculation of the mean and standard deviation are expected to be completed using the graphic display calculator (GDC) – formulae are no longer required and the covariance will not be given in questions. Many candidates, however, were unable to calculate the mean and standard deviation of a (grouped) frequency distribution, instead treating the data as raw; comments on the G2 forms from schools indicated that some teachers were also unable to do this and advice must be sought.
For the great majority, this was a straightforward and accessible question. There were many, however, who had no appreciation of medians, percentiles and quartiles – all straightforward concepts. Most were able to read from the graph, using correctly the scales; only the weakest misinterpreting these. Calculation of the mean and standard deviation are expected to be completed using the graphic display calculator (GDC) – formulae are no longer required and the covariance will not be given in questions. Many candidates, however, were unable to calculate the mean and standard deviation of a (grouped) frequency distribution, instead treating the data as raw; comments on the G2 forms from schools indicated that some teachers were also unable to do this and advice must be sought.
For the great majority, this was a straightforward and accessible question. There were many, however, who had no appreciation of medians, percentiles and quartiles – all straightforward concepts. Most were able to read from the graph, using correctly the scales; only the weakest misinterpreting these. Calculation of the mean and standard deviation are expected to be completed using the graphic display calculator (GDC) – formulae are no longer required and the covariance will not be given in questions. Many candidates, however, were unable to calculate the mean and standard deviation of a (grouped) frequency distribution, instead treating the data as raw; comments on the G2 forms from schools indicated that some teachers were also unable to do this and advice must be sought.
For the great majority, this was a straightforward and accessible question. There were many, however, who had no appreciation of medians, percentiles and quartiles – all straightforward concepts. Most were able to read from the graph, using correctly the scales; only the weakest misinterpreting these. Calculation of the mean and standard deviation are expected to be completed using the graphic display calculator (GDC) – formulae are no longer required and the covariance will not be given in questions. Many candidates, however, were unable to calculate the mean and standard deviation of a (grouped) frequency distribution, instead treating the data as raw; comments on the G2 forms from schools indicated that some teachers were also unable to do this and advice must be sought.
For the great majority, this was a straightforward and accessible question. There were many, however, who had no appreciation of medians, percentiles and quartiles – all straightforward concepts. Most were able to read from the graph, using correctly the scales; only the weakest misinterpreting these. Calculation of the mean and standard deviation are expected to be completed using the graphic display calculator (GDC) – formulae are no longer required and the covariance will not be given in questions. Many candidates, however, were unable to calculate the mean and standard deviation of a (grouped) frequency distribution, instead treating the data as raw; comments on the G2 forms from schools indicated that some teachers were also unable to do this and advice must be sought.