| Date | November 2013 | Marks available | 5 | Reference code | 13N.1.bp.1 |
| Level | SL and HL | Paper | 1 | Time zone | |
| Command term | Explain | Question number | 1 | Adapted from | N/A |
Question
The map shows the maternal mortality ratio (maternal deaths per 100 000 live births) for different countries in 2010.
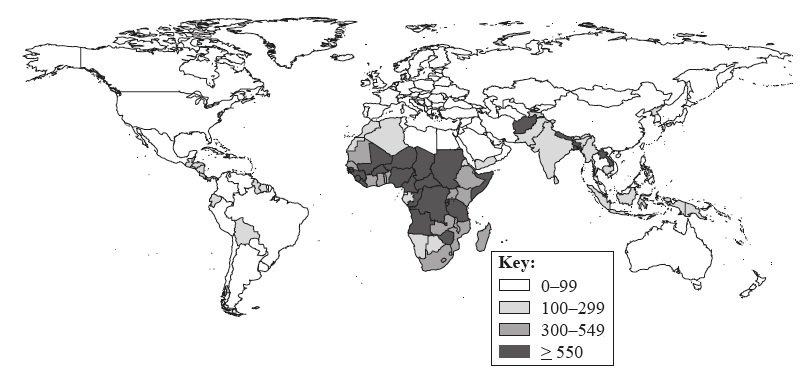
[Source: Reproduced, with the permission of the publisher, from Trends in Maternal Mortality: 1990 to 2010. Geneva, World Health Organization, Fig. 1, p. 23. http://www.unfpa.org/webdav/site/global/shared/documents/publications/2012/Trends_in_maternal_mortality_A4-1.pdf (accessed 08/01/2014)]
Briefly describe the global pattern of the maternal mortality ratio shown on the map.
Suggest two reasons why the maternal mortality ratio is so high in some countries.
Explain the recent trends in life expectancy at birth for a named country or region.
Markscheme
The map shows that highest maternal mortality ratios (MMR) are in sub-Saharan Africa and South Asia [1 mark]; the MMR is low in Europe, North America, Australasia and most of the rest of Asia [1 mark], variation in MMR within Latin America and the Caribbean [1 mark], identification of anomalies [1 mark]. Award up to a maximum of [2 marks] if no quantification/use of data.
Award [1 mark] for each valid reason, and an additional [1 mark] for its development, exemplification or further explanation.
Possible reasons include: lack of trained health personnel; lack of access to health care; higher fertility; age of mothers; birth spacing; conflict; remoteness; lower status of women; malnutrition; poverty.
Allow other valid reasons.
If not related to maternal mortality award up to a maximum of [2 marks].
Answers will depend on the country/region chosen.
Award up to a maximum of [2 marks] for describing the recent trends and up to [3 marks] for explaining why they occur.
For example, increased life expectancy could be linked to improved nutrition, health care, sanitation.
For example, reduced life expectancy could be linked to HIV, AIDS, lifestyle issues, diet.
If no named country/region or outdated examples are used, marks will be limited to a maximum of [3 marks]. If no reference to trends or change award up to a maximum of [2 marks].
If more than one country/region is used, credit the best one only.