 Wave motion can be represented by graphs. The axes can include x-displacement, y-displacement, velocity, acceleration and time. However, take care to realise that a graph is not a picture of a wave.
Since there is no energy transfer, a pendulum wave isn't really a wave... but it looks impressive!
Key Concepts
A wave is made of a series of out of phase oscillations.
A transverse wave can be represented by graphs of:
- displacement-time
- displacement-position
A longitudinal wave doesn't look like a sinousoidal wave because the oscillations are parallel to the direction of wave propagtation. However if graphs are drawn, the sinusoidal nature is revealed.
It is difficult to plot the displacement of the points on a longitudinal wave, but easy to represent them with a displacement-position graph.
Use quizzes to practise application of theory.
START QUIZ!
Graphical representation of a wave 1/1
This simulation of wave motion was made with GeoGebra.
Which of the following statement about points A and B is false
A and B are π/2 out of phase
The diagram represents 5 points on a wave moving to the right
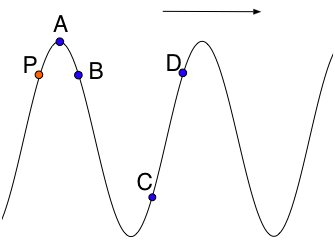
Which point is in phase with P
P and D are one wavelength apart
This simulation of wave motion was made with GeoGebra.
The phase difference between neighbouring green particles is
The phase difference between each particle and the one furthest left increases towards the right but the phase difference between neighbours is constant.
The equation of a wave is of the form
y = A sin (Bt -Cx)
The amplitude of the wave is defined by
y = A sin(2πft - 2πx/λ)
The equation of a wave is of the form
y = A sin (Bt -Cx)
The frequency of the wave is defined by
y = A sin(2πft - 2πx/λ)
The equation of a wave is of the form
y = A sin (Bt -Cx)
The wavelength of the wave is defined by
y = A sin(2πft - 2πx/λ)
The equation of a wave is of the form
y = A sin (Bt -Cx)
The velocity of the wave is defined by
y = A sin(2πft - 2πx/λ)
The equation of a wave is
y = 10 sin (8πt - πx)
The frequency of the wave is
y = A sin(2πft - 2πx/λ) so f = 4 Hz
The equation of a wave is
y = 10 sin (8πt - πx)
The wavelength of the wave is
y = A sin(2πft - 2πx/λ) so λ = 2 m
The equation of a wave is
y = 10 sin (8πt - πx)
The velocity of the wave is
y = A sin(2πft - 2πx/λ) so f = 4 Hz and λ = 2 m v = fλ = 8 ms-1
The diagram below shows a wave plus 4 graphs of displacement vs position
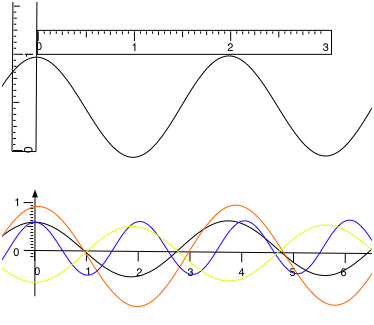
Which line represents the wave shown?
The wave has wavelength 2 units and amplitude about 0.5 units
The diagram below shows a wave plus 4 graphs of displacement vs position
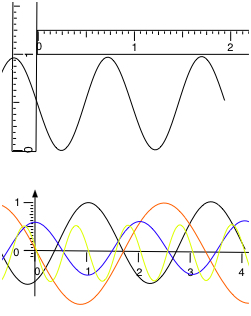
Which line represents the wave shown?
Wavelength is 1 unit amplitude is 0.5 units
The diagram shows a wave plus 4 graphs of displacement vs time (s)
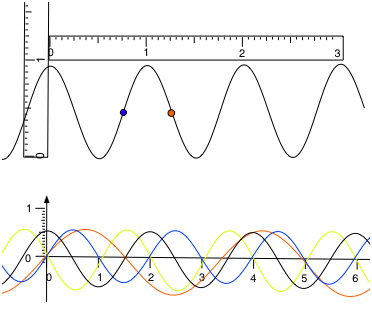
If the wave is travelling to the right and the frequency is 0.5 Hz which line represents the displacement of the blue dot?
Time period is 2 s
Amplitude is 0.5 units
at time 0s the dot is at zero displacement and a short time later it has negative displacement
The diagram shows a wave plus 4 graphs of displacement vs time (s)

If the wave is travelling to the left and the frequency is 0.5 Hz which line represents the displacement of the blue dot?
Time period is 2 s
Amplitude is 0.5 units
at time 0s the dot is at zero displacement and a short time later it has positive displacement
The diagram shows a wave plus 4 graphs of displacement vs time (s)

If the wave is travelling to the right and the frequency is 0.5 Hz which line represents the displacement of the red dot?
Time period is 2 s
Amplitude is 0.5 units
at time 0s the dot is at zero displacement and a short time later it has positive displacement
The diagram shows a wave travellling to the right and a graph of displacement vs time (s)
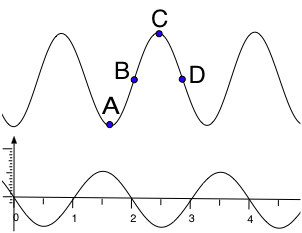
The graph is drawn for point
At time 0 s point B is at zero displacement, a short time later it has negative displacement.
The diagram shows a wave travelling to the left and a graph of displacement vs time (s)

The graph is drawn for point
At time 0 s point B is at zero displacement, a short time later it has negative displacement.
The images below are taken from a GeoGebra simulation of longitudinal waves. The blue dots are the undisturbed positions.
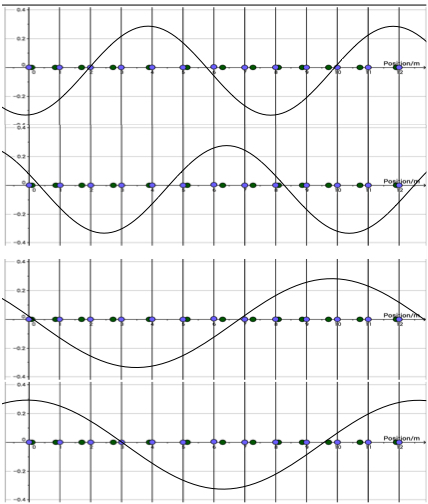
Which graph is the correct displacement position graph for the longitudinal wave
0 has small + displacement
2 has large - displacment
5 has small + displacement
The images below are taken from a GeoGebra simulation of longitudinal waves. The blue dots are the undisturbed positions.
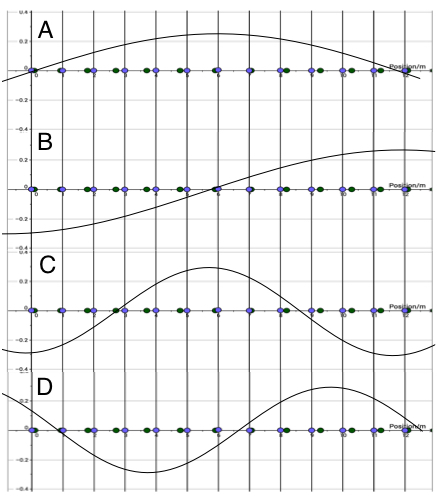
Which graph is the correct displacement position graph for the longitudinal wave
1 has almost zero displacement
4 has large - displacement
7 has small + displacement
The image below shows a GeoGebra simulation of a longitudinal wave of frequency 0.5 Hz travelling to the right.
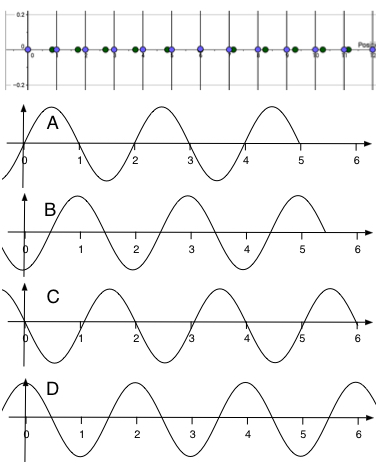
Which graph represents the displacement time graph for point 6?
Point 6 is at zero displacement and will go to negative displacement (look at the position of 5 this is what will happen to 6 next)
The image below shows a GeoGebra simulation of a longitudinal wave of frequency 0.5 Hz travelling to the right.

Which graph represents the displacement time graph for point 3?
Point 3 is at max - displacement and will go to zero displacement (look at the position of 2 this is what will happen to 6 next)
The image below shows a GeoGebra simulation of a longitudinal wave of frequency 0.5 Hz travelling to the right.

Which graph represents the displacement time graph for point 0?
Point 0 is at zero displacement and will go to negative displacement (look at the position of 1 this is what just happened to 0. 0 was at a - displacement so will have + displacement next)
How much of Graphical representation of waves have you understood?
Feedback
Which of the following best describes your feedback?


 The generic wave equation is as follows:
 Twitter
  Facebook
  LinkedIn