
 This page is all about looking for correlations in bivariate data (to see if there is a relationship between x and y variables). You will learn how to calculate r, Pearson’s product-moment correlation coefficient and how to interpret it. We will look at y on x regression as well as x on y regression using them to consider interpolation and extrapolation.
On this page, you should learn about
- linear correlation of bi-variate data
- scatter diagrams
- y on x regression line
- x on y regression line
- interpolation and extrapolation
- Pearson' product-moment correlation coefficient, \(r\)
Print from here
Here is a quiz that gets you to estimate the r value for different graphs
START QUIZ!
Which of the following gives the best estimate for the r value for this y-on-x regression line
Which of the following gives the best estimate for the r value for this y-on-x regression line
Which of the following gives the best estimate for the r value for this y-on-x regression line
Which of the following gives the best estimate for the r value for this y-on-x regression line
r = 0
This means that there is no correlation. In these cases, we should NOT draw a line of regression.
Which of the following gives the best estimate for the r value for this y-on-x regression line
Which of the following gives the best estimate for the r value for this y-on-x regression line
Which of the following gives the best estimate for the r value for this y-on-x regression line
Which of the following gives the best estimate for the r value for this y-on-x regression line
Which of the following gives the best estimate for the r value for this y-on-x regression line
Which of the following gives the best estimate for the r value for this y-on-x regression line
Here is a quiz that tests your understanding of linear correlation
START QUIZ!
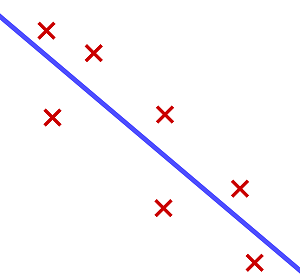
What does this graph demonstrate?
Vertical residuals are for y on x regression
The line of best fit is sloping down (negative gradient), so the correlation is negative. In this case r would have a negative value.
What does this graph demonstrate?
Horizontal residuals are for x on y regression
The line of best fit is sloping down (negative gradient), so the correlation is negative. In this case r would have a negative value.
Use your graphical calculator to calculate the y on x regression line, y = ax + b for the data below
| x | y |
| 2.5 | 12.1 |
| 3.3 | 15.6 |
| 3.7 | 14.9 |
| 4.0 | 18.8 |
| 4.9 | 23 |
Give the values correct to 2 significant figures
y = ax + b
a \(\approx\)
b \(\approx\)
Enter the data into your GDC
Ensure that x variable is list 1 and y variables is list 2
Round the answers carefully
Use your graphical calculator to calculate the correlation coefficient r for the data below
| x | y |
| 2.5 | 12.1 |
| 3.3 | 15.6 |
| 3.7 | 14.9 |
| 4.0 | 18.8 |
| 4.9 | 23 |
Give your answer correct to 3 significant figures
r \(\approx\)
Enter the data into your GDC
The full answer displayed on your calculator is r \(\approx\) 0.905784809
Ensure that you round this answer correctly
Use your graphical calculator to calculate the x on y regression line, x = ay + b for the data below
| x | y |
| 43 | 10 |
| 33 | 15 |
| 39 | 22 |
| 25 | 24 |
| 21 | 27 |
Give the values correct to 2 significant figures
x = ay + b
a \(\approx\)
b \(\approx\)
Enter the data into your GDC
Ensure that x variable is list 2 and y variables is list 1
Round the answers carefully
The relationship between the volume in \(cm^3\) of a parcel (x) and the mass in g of the parcel (y) is given by the y on x regression line
y = 2.1x - 15
A parcel has volume 250\(cm^3\). Calculate the mass.
mass =
y = 2.1x - 15
y = 2.1x250 - 15
y = 510
The x on y line of regression for the two variables x and y is given by
x = -3.2y + 48
Find x when y = 12
x =
x = -3.2y + 48
x = -3.2x12 + 48
x = 9.6
The world record times for men's 100m over time is given below. The time in seconds (y) in the year (x) can be modelled by the equation y = -0.010x + 30
Find the world record time in 1900.
1900 is outside of the range of data that is given. We cannot assume that the linear model would be appropriate before the 1930s. We should not extrapolate.
This is a good example of why we should not extrapolate. If world record times continue to follow this linear model, then at some point in the future the world record time would be 0s. Clearly this cannot happen!
The following graph shows the distances hit by a golfer. X represents loft angle in degrees and y represents the distance in metres.
The y on x line of repression is y = - 3.7x + 320
Work out the distance hit by a club with loft angle = 30°
Here we are interpolating a result from data given
y = - 3.7x + 320
y = - 3.7x30 + 320
y = 209
The following graph shows the distances hit by a golfer. X represents loft angle in degrees and y represents the distance in metres.
The y on x line of repression is y = - 3.7x + 320
Work out the distance hit by a club with loft angle = 70°
Here we are using a model to predict a value that is outside of the range of values given. We do not know if the model will continue in this linear pattern for values of x greater than 60°. We should not extrapolate.


The world record times in seconds for the women’s 100m sprint from 1970 onwards are given below
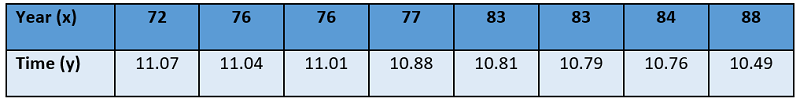
Use your calculator to write down
a) \(\bar{x}\) , the mean year
b) \(\bar{y}\) , the mean time
c) \(r\), Pearson’s product-moment correlation coefficient
The equation of the regression line y on x is y = ax + b
d) Find the values of a and b for these data
e) Show that \((\bar{x},\bar{y})\) lies on this line
f) Use the regression line to estimate the world record time in 2024
Hint
Full Solution

The table below shows the test scores of SL students following a six-week revision period using studyib.
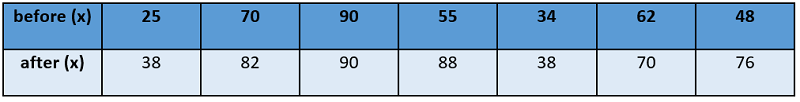
a) Work out r, Pearson’s correlation coefficient
The y on x regression line is y = ax + b
b) Find a and b
c) A student scores 80 marks before revision. Use the regression line to estimate the score after revision
The x on y regression line is x = cx + d
d) Find c and d
e) A student scores 90 marks after revision. Use the regression line to estimate the score before revision
f) Find the point of intersection of the y on x and the x on y regression lines
Hint
Full Solution

The following table shows the hand spans and the heights of eight basketball players on a team
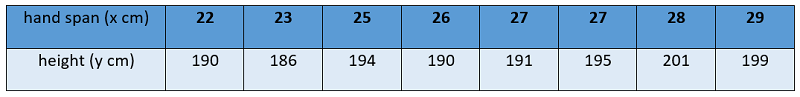
The relationship between x and y can be modelled by the x on y line of regression x = ay + b
- Find the values of a and b
- Write down the correlation coefficient
- Another basketball player is 193cm tall. Use this regression line to estimate the handspan of this player.
Another player is 180cm tall. Use this regression line to estimate the handspan of this player.
Hint
Full Solution
The following table shows the age in days (x) and length of new-born babies in cm (y).
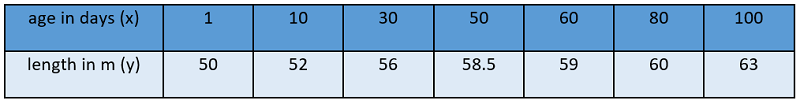
The relationship between the variables is modelled by the regression line with equation y = ax + b
a) Find the values of a and b
b) Write down the correlation coefficient
c) Use your equation to estimate the length of a baby that is 40 days old
d) Use your equation to estimate the length of a baby that is 150 days old
e) Use your equation to estimate the age of a child that is 54 cm long.
Hint
Full Solution
How much of Linear Correlation have you understood?
 Twitter
  Facebook
  LinkedIn