| Date | May 2021 | Marks available | 3 | Reference code | 21M.1.SL.TZ2.7 |
| Level | Standard Level | Paper | Paper 1 (without calculator) | Time zone | Time zone 2 |
| Command term | Estimate | Question number | 7 | Adapted from | N/A |
Question
A large school has students from Year 6 to Year 12.
A group of students in Year 12 were randomly selected and surveyed to find out how many hours per week they each spend doing homework. Their results are represented by the following cumulative frequency graph.
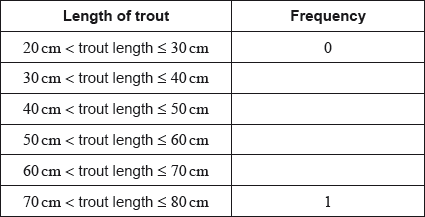
This same information is represented by the following table.
There are students in Year 12 at this school.
Find the median number of hours per week these Year 12 students spend doing homework.
Given that of these Year 12 students spend more than hours per week doing homework, find the value of .
Find the value of and the value of .
Estimate the number of Year 12 students that spend more than hours each week doing homework.
Explain why this sampling method might not provide an accurate representation of the amount of time all of the students in the school spend doing homework.
Suggest a more appropriate sampling method.
Markscheme
evidence of median position (M1)
students
median (hours) A1
[2 marks]
recognizing there are students in the top (M1)
students spent less than hours (A1)
(hours) A1
[3 marks]
hours is students OR (M1)
A1
hours is students OR OR (A1)
A1
[4 marks]
of the students OR spend more than hours doing homework (A1)
OR OR (A1)
(students) A1
[3 marks]
only year 12 students surveyed OR amount of homework might be different for different year levels R1
[1 mark]
stratified sampling OR survey students in all years R1
[1 mark]


