| Date | November 2016 | Marks available | 3 | Reference code | 16N.1.SL.TZ0.T_2 |
| Level | Standard Level | Paper | Paper 1 (with calculator from previous syllabus) | Time zone | Time zone 0 |
| Command term | Draw | Question number | T_2 | Adapted from | N/A |
Question
A sample of 120 oranges was tested for Vitamin C content. The cumulative frequency curve below represents the Vitamin C content, in milligrams, of these oranges.
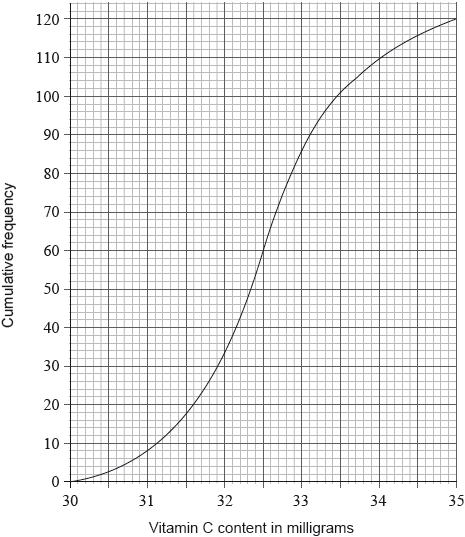
The minimum level of Vitamin C content of an orange in the sample was 30.1 milligrams. The maximum level of Vitamin C content of an orange in the sample was 35.0 milligrams.
Giving your answer to one decimal place, write down the value of
(i) the median level of Vitamin C content of the oranges in the sample;
(ii) the lower quartile;
(iii) the upper quartile.
Draw a box-and-whisker diagram on the grid below to represent the Vitamin C content, in milligrams, for this sample.

Markscheme
* This question is from an exam for a previous syllabus, and may contain minor differences in marking or structure.
(i) 32.5 (A1)
(ii) 31.9 (A1)
(iii) 33.1 (A1) (C3)
Note: Answers must be given correct to 1 decimal place.
[3 marks]
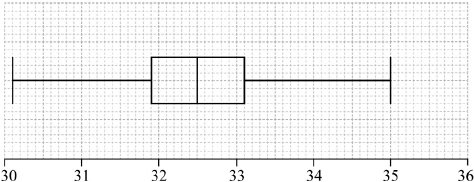
Note: Award (A1)(ft) for correct median, (A1)(ft) for correct quartiles and box, (A1) for correct end points of whiskers and straight whiskers.
Award at most (A1)(A1)(A0) if a horizontal line goes right through the box or if the whiskers are not well aligned with the midpoint of the box.
Follow through from part (a).
[3 marks]
Examiners report
Syllabus sections
-
19M.1.SL.TZ2.T_6b.ii:
Write down the approximate number of snacks whose amount of sugar ranges from 18 to 20 grams.
-
19M.1.SL.TZ1.T_2b:
Write down the median speed for these animals.
-
18M.2.SL.TZ1.T_2a:
State the alternative hypothesis.
-
18M.2.SL.TZ1.T_2d.i:
Write down the χ2 statistic.
-
18M.2.SL.TZ1.T_2d.ii:
Write down the associated p-value.
-
18N.1.SL.TZ0.T_2b:
Find the median length of the rods.
-
18N.1.SL.TZ0.T_2c.ii:
Calculate the interquartile range.
-
19M.1.SL.TZ1.T_5a:
Complete the cumulative frequency table.
-
18M.1.SL.TZ1.T_6c.i:
Write down the mid-interval value for the 100 < x ≤ 150 group.
-
18M.1.SL.TZ2.T_12a:
Write down the mid-interval value for 10 ≤ t < 15.
-
18M.1.SL.TZ2.T_12b.i:
Write down the total number of customers in terms of k.
-
18N.2.SL.TZ0.T_3b:
Find the final examination result required to obtain the highest possible grade.
-
19M.1.SL.TZ2.T_12b:
On the same grid, complete the cumulative frequency curve for these data.
-
18N.2.SL.TZ0.T_3a.i:
Find the median of the examination results.
-
18N.1.SL.TZ0.T_2c.i:
Calculate the lower quartile.
-
17M.1.SL.TZ1.T_1b:
State whether length of trout is a continuous or discrete variable.
-
19M.1.SL.TZ1.T_2a:
State whether speed is a continuous or discrete variable.
-
19M.1.SL.TZ2.T_6b.i:
Write down the interquartile range for this data.
-
18M.1.SL.TZ1.T_6b:
Complete the table.
-
17M.1.SL.TZ2.S_8a.ii:
Write down the number of employees who worked 50 hours or less.
-
17N.2.SL.TZ0.S_8c:
Write down the number of low production hives.
-
19M.1.SL.TZ1.T_2d.ii:
For these eight animals write down the standard deviation.
-
18M.1.SL.TZ2.T_12c:
Hence, complete the histogram.
-
19M.1.SL.TZ2.T_12a.i:
.
-
18M.2.SL.TZ2.T_2b.i:
Use the cumulative frequency curve to find the median distance.
-
18M.2.SL.TZ2.T_2b.iii:
Use the cumulative frequency curve to find the upper quartile.
-
18M.2.SL.TZ2.T_2d:
Write down the percentage of buses that travelled a distance greater than the upper quartile.
-
18M.2.SL.TZ2.T_2e:
Find the number of buses that travelled a distance less than or equal to 12 000 km.
-
18M.2.SL.TZ2.T_2g:
The smallest distance travelled by one of the buses was 2500 km.
The longest distance travelled by one of the buses was 23 000 km.On graph paper, draw a box-and-whisker diagram for these data. Use a scale of 2 cm to represent 5000 km.
-
17N.2.SL.TZ0.T_1f.i:
Write down the -value for the test;
-
18M.1.SL.TZ1.T_6a:
Write down the median.
-
18N.2.SL.TZ0.T_3d.i:
Calculate an estimate of the mean examination result.
-
17M.1.SL.TZ2.S_8a.i:
Find the median number of hours worked by the employees.
-
SPM.1.SL.TZ0.7d:
Write down the value of .
-
SPM.1.SL.TZ0.7a:
Find the median number of minutes spent traveling to work.
-
19M.1.SL.TZ2.T_12c:
Use the cumulative frequency curve to find an estimate for the number of students who worked at most 35 hours per month.
-
19M.1.SL.TZ2.T_6c:
The health inspector visits two school cafeterias. She inspects the same number of meals at each cafeteria. The data is shown in the following box-and-whisker diagrams.

Meals prepared in the school cafeterias are required to have less than 10 grams of sugar.
State, giving a reason, which school cafeteria has more meals that do not meet the requirement.
-
17M.1.SL.TZ2.S_8b.i:
Find the amount of money an employee earned for working 40 hours;
-
17N.2.SL.TZ0.S_8e:
Adam decides to increase the number of bees in each low production hive. Research suggests that there is a probability of 0.75 that a low production hive becomes a regular production hive. Calculate the probability that 30 low production hives become regular production hives.
-
18M.2.SL.TZ2.T_2b.ii:
Use the cumulative frequency curve to find the lower quartile.
-
17N.2.SL.TZ0.S_8d.ii:
Find the number of hives that have a high production.
-
17M.1.SL.TZ2.S_8b.ii:
Find the amount of money an employee earned for working 43 hours.
-
18N.2.SL.TZ0.T_3d.ii:
Calculate an estimate of the standard deviation, giving your answer correct to three decimal places.
-
18M.2.SL.TZ2.T_2f:
Find the value of m.
-
SPM.1.SL.TZ0.7f:
Travelling times of less than minutes are considered outliers.
Find the value of .
-
17N.2.SL.TZ0.S_8a:
Write down the value of and of .
-
18N.1.SL.TZ0.T_2a:
Write down the modal length of the rods.
-
18M.1.SL.TZ2.T_7b:
Find the probability that the boy answered questions in Hindi.
-
17M.1.SL.TZ2.S_8d:
Only 10 employees earned more than £. Find the value of .
-
20N.1.SL.TZ0.T_3b:
Use your graphic display calculator to find an estimate of the standard deviation of the weights of mangoes from this harvest.
-
18M.2.SL.TZ1.T_2g:
Given that this flight was not heavily delayed, find the probability that it travelled between 500 km and 5000 km.
-
19M.1.SL.TZ1.T_2c:
Write down the range of the animal speeds.
-
17N.2.SL.TZ0.T_1b.i:
Write down, for , the modal class;
-
18M.2.SL.TZ2.T_2c:
Hence write down the interquartile range.
-
SPM.1.SL.TZ0.7b:
Find the number of employees whose travelling time is within 15 minutes of the median.
-
22M.2.SL.TZ2.5c:
State why it appears that the mean reaction time is greater than the median reaction time.
-
22M.2.SL.TZ2.5d:
Now consider the two box and whisker diagrams.
Comment on whether these box and whisker diagrams provide any evidence that might suggest that not sleeping well causes an increase in reaction time.
-
20N.1.SL.TZ0.S_8d:
Find .
-
17M.1.SL.TZ2.S_8c:
Find the number of employees who earned £200 or less.
-
20N.1.SL.TZ0.S_8b:
Write down the value of the median distance in kilometres (km).
-
21M.1.SL.TZ1.4b:
Hence, find the minimum possible value of .
-
SPM.1.SL.TZ0.7e.i:
Find the value of .
-
17M.1.SL.TZ2.T_7c:
Find the value of and of .
-
20N.1.SL.TZ0.S_8c:
Find the value of .
-
21M.1.SL.TZ2.7a:
Find the median number of hours per week these Year 12 students spend doing homework.
-
21M.1.SL.TZ2.7e.i:
Explain why this sampling method might not provide an accurate representation of the amount of time all of the students in the school spend doing homework.
-
21M.1.SL.TZ2.7d:
Estimate the number of Year 12 students that spend more than hours each week doing homework.
-
21M.1.SL.TZ2.7e.ii:
Suggest a more appropriate sampling method.
-
17N.2.SL.TZ0.S_8d.i:
Find the value of ;
-
21M.1.SL.TZ1.4a:
Find the minimum possible value of .
-
SPM.1.SL.TZ0.7c:
Find the value of .
-
22M.2.SL.TZ2.5a:
State the median reaction time after sleeping well.
-
22M.1.SL.TZ1.3a:
Find the largest value of that would not be considered an outlier.
-
19M.1.SL.TZ2.T_12a.ii:
.
-
19M.1.SL.TZ1.T_2d.i:
For these eight animals find the mean speed.
-
18M.1.SL.TZ2.T_7a:
State the number of boys who answered questions in Portuguese.
-
17N.1.SL.TZ0.T_1a.ii:
For the students in this group write down the median age.
-
17M.1.SL.TZ2.T_6b:
Write down the number of leaves with a length less than or equal to 8 cm.
-
19M.1.SL.TZ1.T_5c:
A customer buys a large bouquet.
Find the probability that there are 12 roses in this bouquet.
-
19M.1.SL.TZ2.T_6a:
State what 13 represents in the given diagram.
-
17N.2.SL.TZ0.T_1c.i:
Use your graphic display calculator to estimate the mean of ;
-
18M.2.SL.TZ1.T_2e:
State, with a reason, whether you would reject the null hypothesis.
-
17M.1.SL.TZ2.T_7b:
Using the mean score, write down a second equation in terms of and .
-
20N.1.SL.TZ0.T_3c:
On the grid below, draw a histogram for the data in the table.

-
17M.1.SL.TZ2.T_6a:
Write down the median length of these leaves.
-
17N.1.SL.TZ0.T_1b:
Draw a box-and-whisker diagram, for these students’ ages, on the following grid.

-
17M.1.SL.TZ2.T_6c.ii:
Before measuring, the researcher estimated to be approximately 9.5 cm. Find the percentage error in her estimate.
-
17M.1.SL.TZ2.T_7a:
Write down an equation, in terms of and , for the total number of times the die was rolled.
-
19M.1.SL.TZ1.T_5b:
Write down the probability that a bouquet of roses sold is not small.
-
SPM.1.SL.TZ0.7e.ii:
Hence, find the interquartile range.
-
18M.2.SL.TZ1.T_2h:
Two flights are chosen at random from those which were slightly delayed.
Find the probability that each of these flights travelled at least 5000 km.
-
17N.2.SL.TZ0.T_1g:
State the result of the test. Give a reason for your answer.
-
18M.1.SL.TZ1.T_6c.ii:
Using the table, calculate an estimate for the mean number of people being followed on the social media website by these 160 students.
-
20N.1.SL.TZ0.S_8a:
Find the value of .
-
17N.2.SL.TZ0.S_8b:
Use this regression line to estimate the monthly honey production from a hive that has 270 bees.
-
20N.1.SL.TZ0.S_8e:
The first athletes that completed the race won a prize.
Given that an athlete took between and minutes to complete the race, calculate the probability that they won a prize.
-
18M.2.SL.TZ1.T_2b:
Calculate the expected frequency of flights travelling at most 500 km and arriving slightly delayed.
-
21M.1.SL.TZ2.7b:
Given that of these Year 12 students spend more than hours per week doing homework, find the value of .
-
21M.1.SL.TZ2.7c:
Find the value of and the value of .
-
18M.1.SL.TZ2.T_12b.ii:
Calculate the value of k.
-
17N.2.SL.TZ0.T_1b.ii:
Write down, for , the mid-interval value of the modal class.
-
18M.2.SL.TZ1.T_2c:
Write down the number of degrees of freedom.
-
17N.2.SL.TZ0.T_1a:
State whether is a discrete or a continuous variable.
-
17N.2.SL.TZ0.T_1f.ii:
Write down the statistic.
-
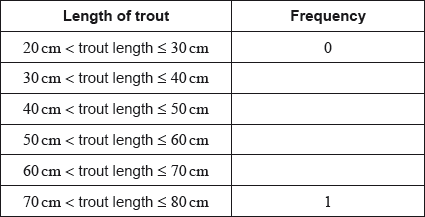
17M.1.SL.TZ1.T_1d:
Any trout with length 40 cm or less is returned to the lake.
Calculate the percentage of the fisherman’s catch that is returned to the lake.
-
17M.1.SL.TZ1.T_1a:
Complete the following table.
-
17N.1.SL.TZ0.T_1a.i:
For the students in this group find the mean age;
-
17M.1.SL.TZ1.T_1c:
Write down the modal class.
-
16N.1.SL.TZ0.T_2a:
Giving your answer to one decimal place, write down the value of
(i) the median level of Vitamin C content of the oranges in the sample;
(ii) the lower quartile;
(iii) the upper quartile.
-
20N.1.SL.TZ0.T_3a:
Write down the modal group for these data.
-
18M.1.SL.TZ2.T_7c:
Two girls are selected at random.
Calculate the probability that one girl answered questions in Mandarin and the other answered questions in Hindi.
-
17M.1.SL.TZ2.T_6c.i:
Use the graph to find the value of .
-
18M.2.SL.TZ1.T_2f:
Write down the probability that this flight arrived on time.
-
17N.2.SL.TZ0.T_1c.ii:
Use your graphic display calculator to estimate the standard deviation of .
-
17N.2.SL.TZ0.T_1d:
Find the expected frequency of students choosing the Science category and obtaining 31 to 40 correct answers.
-
17N.2.SL.TZ0.T_1e.i:
Write down the null hypothesis for this test;
-
17N.2.SL.TZ0.T_1e.ii:
Write down the number of degrees of freedom.
-
18N.2.SL.TZ0.T_3a.ii:
Find the interquartile range.
-
18N.2.SL.TZ0.T_3c.i:
Write down the modal class.
-
18N.2.SL.TZ0.T_3c.ii:
Write down the mid-interval value of the modal class.
-
18N.2.SL.TZ0.T_3e:
The teacher sets a grade boundary that is one standard deviation below the mean.
Use the cumulative frequency graph to estimate the number of students whose final examination result was below this grade boundary.
-
18M.2.SL.TZ2.T_2a:
Find the number of buses that travelled a distance between 15000 and 20000 kilometres.