| Date | May 2017 | Marks available | 1 | Reference code | 17M.1.SL.TZ2.T_6 |
| Level | Standard Level | Paper | Paper 1 (with calculator from previous syllabus) | Time zone | Time zone 2 |
| Command term | Write down | Question number | T_6 | Adapted from | N/A |
Question
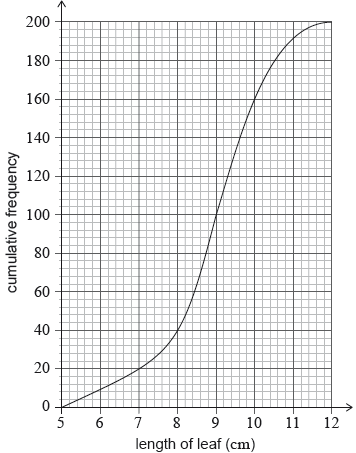
For a study, a researcher collected 200 leaves from oak trees. After measuring the lengths of the leaves, in cm, she produced the following cumulative frequency graph.

The researcher finds that 10% of the leaves have a length greater than cm.
Write down the median length of these leaves.
Write down the number of leaves with a length less than or equal to 8 cm.
Use the graph to find the value of .
Before measuring, the researcher estimated to be approximately 9.5 cm. Find the percentage error in her estimate.
Markscheme
* This question is from an exam for a previous syllabus, and may contain minor differences in marking or structure.
9 (cm) (A1) (C1)
[1 mark]
40 (leaves) (A1) (C1)
[1 mark]
or equivalent (M1)
Note: Award (M1) for a horizontal line drawn through the cumulative frequency value of 180 and meeting the curve (or the corresponding vertical line from 10.5 cm).
(A1) (C2)
Note: Accept an error of ±0.1.
[2 marks]
(M1)
Notes: Award (M1) for their correct substitution into the percentage error formula.
(A1)(ft) (C2)
Notes: Follow through from their answer to part (c)(i).
Award (A1)(A0) for an answer of with or without working.
[2 marks]


