| Date | November 2018 | Marks available | 1 | Reference code | 18N.2.SL.TZ0.T_3 |
| Level | Standard Level | Paper | Paper 2 | Time zone | Time zone 0 |
| Command term | Write down | Question number | T_3 | Adapted from | N/A |
Question
The final examination results obtained by a group of 3200 Biology students are summarized on the cumulative frequency graph.
350 of the group obtained the highest possible grade in the examination.
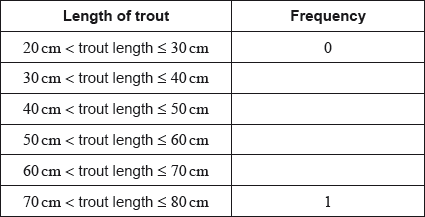
The grouped frequency table summarizes the examination results of this group of students.
Find the median of the examination results.
Find the interquartile range.
Find the final examination result required to obtain the highest possible grade.
Write down the modal class.
Write down the mid-interval value of the modal class.
Calculate an estimate of the mean examination result.
Calculate an estimate of the standard deviation, giving your answer correct to three decimal places.
The teacher sets a grade boundary that is one standard deviation below the mean.
Use the cumulative frequency graph to estimate the number of students whose final examination result was below this grade boundary.
Markscheme
60 (A2)
[2 marks]
68 − 48 (A1)(M1)
Note: Award (A1) for two correct quartiles seen, (M1) for finding the difference between their two quartiles.
= 20 (A1)(ft)(G3)
[3 marks]
3200 − 350 = 2850 (M1)
Note: Award (M1) for 2850 seen. Follow through from their 3200.
(Top grade boundary =) 76 (A1)(ft)(G2)
[2 marks]
60 < x ≤ 80 (A1)(A1)
Note: Award (A1) for 60, 80 seen, (A1) for correct strict and weak inequalities.
[2 marks]
70 (A1)(ft)
Note: Follow through from part (c)(i).
[1 mark]
57.2 (57.1875) (A2)(ft)
Note: Follow through from part (c)(ii).
[2 marks]
18.496 (A1)
Note: Award (A0) for 18.499.
[1 mark]
57.2 − 18.5 (M1)
= 38.7 (38.6918…) (A1)(ft)
Note: Award (M1) for subtracting their standard deviation from their mean. Follow through from part (d) even if no working is shown.
450 (students) (A1)(ft)(G2)
Note: Accept any answer within the range of 450 to 475, inclusive. Follow through from part (d), adjusting the acceptable range as necessary.
[3 marks]


