| Date | May Specimen paper | Marks available | 2 | Reference code | SPM.2.SL.TZ0.8 |
| Level | Standard Level | Paper | Paper 2 | Time zone | Time zone 0 |
| Command term | Hence and Find | Question number | 8 | Adapted from | N/A |
Question
The length, X mm, of a certain species of seashell is normally distributed with mean 25 and variance, .
The probability that X is less than 24.15 is 0.1446.
A random sample of 10 seashells is collected on a beach. Let Y represent the number of seashells with lengths greater than 26 mm.
Find P(24.15 < X < 25).
Find , the standard deviation of X.
Hence, find the probability that a seashell selected at random has a length greater than 26 mm.
Find E(Y).
Find the probability that exactly three of these seashells have a length greater than 26 mm.
A seashell selected at random has a length less than 26 mm.
Find the probability that its length is between 24.15 mm and 25 mm.
Markscheme
attempt to use the symmetry of the normal curve (M1)
eg diagram, 0.5 − 0.1446
P(24.15 < X < 25) = 0.3554 A1
[2 marks]
use of inverse normal to find z score (M1)
z = −1.0598
correct substitution (A1)
= 0.802 A1
[3 marks]
P(X > 26) = 0.106 (M1)A1
[2 marks]
recognizing binomial probability (M1)
E(Y) = 10 × 0.10621 (A1)
= 1.06 A1
[3 marks]
P(Y = 3) (M1)
= 0.0655 A1
[2 marks]
recognizing conditional probability (M1)
correct substitution A1
= 0.398 A1
[3 marks]
Examiners report
Syllabus sections
-
19M.1.SL.TZ1.T_7a:
Place the numbers and in the correct position on the Venn diagram.

-
19M.1.SL.TZ1.T_7b:
In the table indicate which two of the given statements are true by placing a tick (✔) in the right hand column.

-
22M.2.SL.TZ1.6b:
Find .
-
19M.2.AHL.TZ2.H_3a:
Complete the given probability tree diagram for Iqbal’s three attempts, labelling each branch with the correct probability.

-
18N.1.AHL.TZ0.H_1a:
By drawing a Venn diagram, or otherwise, find .
-
19M.2.AHL.TZ1.H_9a.ii:
only a sandwich.
-
19M.2.AHL.TZ1.H_9c.i:
A customer is selected at random. Find the probability that the customer is male and buys a sandwich.
-
19M.2.AHL.TZ1.H_9c.ii:
A female customer is selected at random. Find the probability that she buys a sandwich.
-
18M.2.AHL.TZ1.H_8:
Each of the 25 students in a class are asked how many pets they own. Two students own three pets and no students own more than three pets. The mean and standard deviation of the number of pets owned by students in the class are and respectively.
Find the number of students in the class who do not own a pet.
-
18M.2.SL.TZ1.S_5b:
Given that P((A ∪ B)′ ) = 0.19, find P(A | B′ ).
-
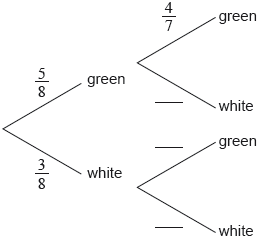
18M.1.SL.TZ2.S_8a:
Copy and complete the following tree diagram.

-
18N.2.SL.TZ0.S_1b.i:
the student does not take art class.
-
19M.1.SL.TZ1.S_1c:
Find .
-
17M.2.SL.TZ1.S_9c:
Find .
-
18N.2.SL.TZ0.S_9c:
A randomly selected participant has a reaction time greater than 0.65 seconds. Find the probability that the participant is in Group X.
-
18N.2.SL.TZ0.S_9a:
A person is selected at random from Group X. Find the probability that their reaction time is greater than 0.65 seconds.
-
18M.2.SL.TZ1.T_2a:
State the alternative hypothesis.
-
18M.2.SL.TZ1.T_2d.i:
Write down the χ2 statistic.
-
18M.2.SL.TZ1.T_2d.ii:
Write down the associated p-value.
-
19M.1.SL.TZ1.T_5a:
Complete the cumulative frequency table.
-
18M.1.SL.TZ2.T_9b.ii:
Shade, on the Venn diagram, the region represented by the set .

-
18M.2.SL.TZ2.T_1c.i:
Find the value of x.
-
18M.2.SL.TZ1.T_5c:
Copy the probability tree diagram and write down the relevant probabilities along the branches.
-
18M.2.SL.TZ1.T_5e:
120 contestants attempted this game.
Find the expected number of contestants who fell into a trap while attempting to pass through a door in the third wall.
-
19M.2.SL.TZ2.T_1c.i:
the expected frequency of female students who chose to take the Chinese class.
-
17M.1.SL.TZ1.T_7a:
Complete the tree diagram.
-
18M.2.SL.TZ1.T_5a:
Write down the probability that Ayako avoids the trap in this wall.
-
17M.1.AHL.TZ1.H_10b.iii:
By considering the graph of f write down the mode of .
-
17M.1.SL.TZ1.T_4c.ii:
Write down .
-
17N.1.SL.TZ0.T_7a:
Complete the Venn diagram for these students.
-
18M.1.SL.TZ2.T_9a.i:
Write down an expression, in set notation, for the shaded region represented by Diagram 1.
-
19M.1.SL.TZ2.T_5a:
Using the given information, complete the following Venn diagram.

-
18N.1.SL.TZ0.T_8a:
Complete the tree diagram.

-
18N.2.SL.TZ0.T_2b.i:
Write down .
-
19M.2.SL.TZ1.S_10c.i:
Write down the value of .
-
19M.1.SL.TZ1.S_1b:
Find the value of .
-
18N.2.SL.TZ0.T_2b.ii:
Write down .
-
17M.1.SL.TZ2.T_10a:
Write down the probability that a light bulb produced by Home Shine is not defective.
-
17N.1.SL.TZ0.S_1a:
Complete the following tree diagram.
-
18N.1.SL.TZ0.S_9a.ii:
Find the probability, in terms of , that the game will end on her second draw.
-
19M.2.AHL.TZ1.H_9b.ii:
Find the probability that more than 100 cakes will be sold on a typical day.
-
17M.1.SL.TZ1.T_4b:
Determine whether rock-climbing is offered by the school in the fall/autumn trimester.
-
19M.2.SL.TZ2.S_9c:
Find the value of .
-
19N.2.SL.TZ0.S_9a:
Calculate the probability a flight is not late.
-
17M.2.SL.TZ1.S_9b:
Find the value of .
-
18M.2.SL.TZ2.T_1c.ii:
Find the value of y.
-
17N.2.SL.TZ0.S_4a:
Find the value of .
-
19M.2.SL.TZ1.S_10c.ii:
Hence, find the value of .
-
18N.1.SL.TZ0.S_9b.ii:
fourth draw.
-
17M.1.SL.TZ1.S_1a.i:
Find the value of ;
-
17M.1.SL.TZ1.T_4a:
Write down the number of sporting activities offered by the school during its school year.
-
17N.2.AHL.TZ0.H_2a:
Find .
-
18N.2.SL.TZ0.S_1b.ii:
the student takes either art class or music class, but not both.
-
19N.1.SL.TZ0.S_2a:
Write down the value of .
-
18N.2.SL.TZ0.S_9d:
Ten of the participants with reaction times greater than 0.65 are selected at random. Find the probability that at least two of them are in Group X.
-
16N.1.SL.TZ0.S_5b:
Find .
-
17M.1.SL.TZ1.S_1a.ii:
Find the value of .
-
19M.2.SL.TZ2.S_9a:
Show that event A and event D are not independent.
-
19M.2.SL.TZ2.T_1e.iii:
Find the probability that at least one of the two students is female.
-
19M.2.SL.TZ2.T_1c.ii:
the statistic.
-
17N.2.SL.TZ0.T_4g:
Estimate the number of employees, from this 38, who are allergic to nuts.
-
19M.2.SL.TZ2.T_1a:
Write down the null hypothesis, H0 , for this test.
-
18M.2.SL.TZ1.S_9b.ii:
Hence, find the value of σ.
-
18M.2.SL.TZ2.T_1a.ii:
Write down the value of b.
-
18M.2.SL.TZ2.T_1d:
Find the number of employees who, in the last year, did not travel to work by car, bicycle or public transportation.
-
17N.2.SL.TZ0.S_4b:
Write down .
-
19M.1.SL.TZ1.T_12c:
Write down the probability that the second spin is yellow, given that the first spin is blue.
-
16N.1.SL.TZ0.T_3a:
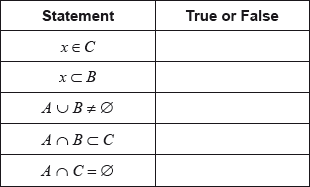
In the table indicate whether the given statements are True or False.
-
18N.1.SL.TZ0.S_9b.i:
third draw.
-
19M.2.SL.TZ2.S_9b.ii:
Given that all passengers for a flight arrive on time, find the probability that the flight does not depart on time.
-
18M.2.SL.TZ1.S_9b.i:
Find the standardized value for 289 g.
-
21N.2.SL.TZ0.9c.iii:
premium.
-
17M.1.AHL.TZ1.H_10c.ii:
Hence state the interquartile range of .
-
18N.2.SL.TZ0.T_2a.ii:
Find the number of students in the school that study Mathematics in English.
-
18M.1.SL.TZ2.T_7b:
Find the probability that the boy answered questions in Hindi.
-
19M.2.AHL.TZ1.H_9a.i:
both a sandwich and a cake.
-
18M.2.SL.TZ1.T_2g:
Given that this flight was not heavily delayed, find the probability that it travelled between 500 km and 5000 km.
-
19N.2.SL.TZ0.S_9c.ii:
Given that at least of these flights are on time, find the probability that exactly flights are on time.
-
19N.2.SL.TZ0.S_9b:
Find the value of .
-
17N.2.SL.TZ0.T_4d:
Find the probability that this adult is allergic to nuts and the liquid turns blue.
-
18N.2.SL.TZ0.S_9b:
The probability that the reaction time of a person in Group Y is greater than 0.65 seconds is 0.396. Find the value of σ.
-
18N.1.SL.TZ0.S_9a.i:
Find the probability, in terms of , that the game will end on her first draw.
-
18M.1.SL.TZ2.S_8e:
Two days next week Pablo will drive to work. Find the probability that he will be late at least once.
-
18M.2.AHL.TZ1.H_6:
The mean number of squirrels in a certain area is known to be 3.2 squirrels per hectare of woodland. Within this area, there is a 56 hectare woodland nature reserve. It is known that there are currently at least 168 squirrels in this reserve.
Assuming the population of squirrels follow a Poisson distribution, calculate the probability that there are more than 190 squirrels in the reserve.
-
22M.1.SL.TZ2.9c:
Assuming that rolls of the die are independent, find the probability that Nicky wins the game.
-
19M.1.SL.TZ1.S_9c:
Write down the standardized value for .
-
22M.2.SL.TZ1.9c.i:
Find the probability that the randomly selected muffin weighs less than .
-
22M.2.SL.TZ1.9c.ii:
Given that a randomly selected muffin weighs less than , find the probability that it is chocolate.
-
22M.2.SL.TZ2.9d:
Given that Suzi will be late to work at least one day next week, find the probability that she will be late less than three times.
-
18M.1.SL.TZ2.S_8b:
Find the probability that Pablo leaves home before 07:00 and is late for work.
-
18M.2.SL.TZ1.S_5a:
Find P(A ∩ B′ ).
-
20N.1.SL.TZ0.T_14a:
Complete the values in the tree diagram.

-
20N.2.SL.TZ0.T_2c:
Write down the value of .
-
20N.2.SL.TZ0.T_2d.ii:
Find the probability that a randomly selected student visited the virtual reality rides.
-
20N.1.SL.TZ0.S_1a.ii:
Find the value of .
-
20N.1.SL.TZ0.S_1b:
Find the probability that a randomly selected student from the class plays tennis or volleyball, but not both.
-
20N.2.SL.TZ0.S_9c:
Find the probability that the bus journey takes less than minutes.
-
20N.2.SL.TZ0.S_9d:
Find the probability that Fiona will arrive on time.
-
20N.2.SL.TZ0.S_9e:
This year, Fiona will go to school on days.
Calculate the number of days Fiona is expected to arrive on time.
-
20N.1.SL.TZ0.T_6a.i:
Find the probability that the first ball chosen is labelled .
-
20N.1.SL.TZ0.T_6a.ii:
Find the probability that the first ball chosen is labelled or labelled .
-
20N.2.SL.TZ0.T_2a.i:
Find the value of .
-
19N.2.SL.TZ0.S_9d:
SpeedWay increases the number of flights from city to city to flights each week, and improves their efficiency so that more flights are on time. The probability that at least flights are on time is .
A flight is chosen at random. Calculate the probability that it is on time.
-
17M.1.AHL.TZ1.H_10b.i:
By considering the graph of f write down the mean of ;
-
19M.2.SL.TZ2.S_9b.i:
Find .
-
18M.2.SL.TZ1.S_9d:
Find the probability that the grocer buys more than half the oranges in a box selected at random.
-
16N.1.AHL.TZ0.H_10a:
Show that .
-
16N.1.SL.TZ0.T_12b:
Find the value of .
-
20N.2.SL.TZ0.S_9b:
Find .
-
SPM.1.SL.TZ0.2:
Let A and B be events such that , and .
Find .
-
SPM.2.SL.TZ0.8d:
Find the probability that exactly three of these seashells have a length greater than 26 mm.
-
21M.2.SL.TZ2.4a:
Find the probability that the student plays a sport and is involved in theatre.
-
21M.2.SL.TZ2.4d:
Determine if the events and are independent. Justify your answer.
-
SPM.2.SL.TZ0.8a:
Find P(24.15 < X < 25).
-
19M.2.AHL.TZ2.H_3c:
Find the probability that Iqbal passes his third paper, given that he passed only one previous paper.
-
20N.1.SL.TZ0.T_6c:
Find the probability that both balls chosen are labelled .
-
17M.2.AHL.TZ1.H_1a:
Calculate ;
-
SPM.2.SL.TZ0.8c:
Find E(Y).
-
17N.2.AHL.TZ0.H_2c:
Hence show that events and are independent.
-
17M.1.SL.TZ2.T_10b.i:
Find the probability that both light bulbs are not defective.
-
20N.2.SL.TZ0.S_9a:
Find the probability that it will take Fiona between minutes and minutes to walk to the bus stop.
-
19M.1.SL.TZ1.S_9b:
Given that > −1.6, find the probability that z < 2.4 . Write your answer in terms of and .
-
19M.2.SL.TZ1.S_10a.ii:
Find the probability of rolling two or more red faces.
-
20N.1.SL.TZ0.S_1a.i:
Find the value of .
-
17M.1.AHL.TZ1.H_10c.i:
Show that .
-
18M.2.SL.TZ1.S_9c:
To the nearest gram, find the minimum weight of an orange that the grocer will buy.
-
19N.2.SL.TZ0.S_9c.i:
Calculate the probability that at least of these flights are on time.
-
18N.1.AHL.TZ0.H_1b:
Show that the events and are not independent.
-
18N.1.SL.TZ0.S_9c:
Hayley plays the game when = 5. She pays $20 to play and can earn money back depending on the number of draws it takes to obtain a blue marble. She earns no money back if she obtains a blue marble on her first draw. Let M be the amount of money that she earns back playing the game. This information is shown in the following table.

Find the value of so that this is a fair game.
-
18M.1.SL.TZ2.S_8d:
Given that Pablo is late for work, find the probability that he left home before 07:00.
-
19M.1.SL.TZ1.S_1a:
Find the value of .
-
17M.1.AHL.TZ1.H_10d:
Calculate .
-
EXN.2.AHL.TZ0.9:
A biased coin is weighted such that the probability, , of obtaining a tail is . The coin is tossed repeatedly and independently until a tail is obtained.
Let be the event “obtaining the first tail on an even numbered toss”.
Find .
-
19N.1.SL.TZ0.S_2b:
Find the value of .
-
17M.1.SL.TZ1.T_4c.i:
Write down the elements of the set ;
-
SPM.2.SL.TZ0.8b.i:
Find , the standard deviation of X.
-
19M.2.SL.TZ1.S_10b:
Show that, after a turn, the probability that Ted adds exactly $10 to his winnings is .
-
21M.2.SL.TZ2.4c:
Find .
-
18M.1.SL.TZ2.S_8c:
Find the probability that Pablo is late for work.
-
16N.1.SL.TZ0.S_5a:
Find .
-
SPM.2.SL.TZ0.8e:
A seashell selected at random has a length less than 26 mm.
Find the probability that its length is between 24.15 mm and 25 mm.
-
21N.2.SL.TZ0.9c.ii:
large.
-
21N.2.SL.TZ0.9a:
Find .
-
21N.2.SL.TZ0.9b:
Find the value of and of .
-
21N.2.SL.TZ0.9d:
The selling prices of the different categories of avocado at this supermarket are shown in the following table:

The supermarket pays the farm for the avocados and assumes it will then sell them in exactly the same proportion as purchased from the farm.
According to this model, find the minimum number of avocados that must be sold so that the net profit for the supermarket is at least .
-
22M.2.SL.TZ2.4:
Events and are independent and .
Given that , find .
-
22M.2.AHL.TZ2.8:
Rachel and Sophia are competing in a javelin-throwing competition.
The distances, metres, thrown by Rachel can be modelled by a normal distribution with mean and standard deviation .
The distances, metres, thrown by Sophia can be modelled by a normal distribution with mean and standard deviation .
In the first round of competition, each competitor must have five throws. To qualify for the next round of competition, a competitor must record at least one throw of metres or greater in the first round.
Find the probability that only one of Rachel or Sophia qualifies for the next round of competition.
-
21N.1.SL.TZ0.4a:
A box is chosen at random and a ball is drawn. Find the probability that the ball is red.
-
18M.1.SL.TZ2.T_9b.i:
Shade, on the Venn diagram, the region represented by the set .

-
19M.1.SL.TZ2.T_11b.i:
Write down the elements that belong to .
-
18M.1.SL.TZ2.T_7a:
State the number of boys who answered questions in Portuguese.
-
19M.1.SL.TZ1.T_12a:
Find the probability that both spins are yellow.
-
17N.1.SL.TZ0.T_7b:
One of the students who joined the sports club is chosen at random. Find the probability that this student joined both clubs.
-
16N.1.SL.TZ0.T_3b:
On the Venn diagram, shade the region .
-
18N.1.SL.TZ0.T_8b:
Find the probability that Jorgé chooses a red disc.
-
17M.1.SL.TZ2.T_10b.ii:
Find the probability that at least one of Francesco’s light bulbs is defective.
-
16N.2.SL.TZ0.T_2d:
Find the probability that this person
(i) went on at most one trip;
(ii) went on the coach trip, given that this person also went on both the helicopter trip and the boat trip.
-
19M.1.SL.TZ1.T_5c:
A customer buys a large bouquet.
Find the probability that there are 12 roses in this bouquet.
-
17M.1.SL.TZ2.T_2a:
Write down an expression, in terms of , for the number of children who play only basketball.
-
18M.1.SL.TZ1.T_10b:
Find the value of x.
-
19M.1.SL.TZ2.T_5c:
A student is chosen at random from the surveyed students.
Find the probability that this student likes kiwi fruit smoothies given that they like mango smoothies.
-
18M.2.SL.TZ1.T_2e:
State, with a reason, whether you would reject the null hypothesis.
-
18M.1.SL.TZ2.T_9a.ii:
Write down an expression, in set notation, for the shaded region represented by Diagram 2.
-
19M.1.SL.TZ2.T_11a:
Write down the elements that belong to .
-
17M.1.SL.TZ1.T_2c:
Write down your answer to part (b) in the form where and k .
-
19M.1.SL.TZ1.T_5b:
Write down the probability that a bouquet of roses sold is not small.
-
17N.1.SL.TZ0.T_7c:
Determine whether the events and are independent.
-
17M.1.SL.TZ2.T_10c:
Write down an expression, in terms of , for the probability that at least one of Deborah’s three light bulbs is defective.
-
21N.2.SL.TZ0.4b:
Given that there is at least one defective lamp in the sample, find the probability that there are at most two defective lamps.
-
22M.2.SL.TZ1.6a:
Given that , find the value of .
-
16N.2.SL.TZ0.T_6b:
Express this volume in .
-
16N.2.SL.TZ0.T_6c:
Write down, in terms of and , an equation for the volume of this water container.
-
16N.2.SL.TZ0.T_6e:
Find .
-
16N.2.SL.TZ0.T_6f:
Using your answer to part (e), find the value of which minimizes .
-
19M.2.AHL.TZ1.H_9b.i:
Find the expected number of cakes sold on a typical day.
-
17M.1.SL.TZ2.T_2b:
Complete the Venn diagram using the above information.

-
21M.2.SL.TZ2.4b:
Find the probability that the student is involved in theatre, but does not play a sport.
-
17N.1.SL.TZ0.S_1b:
Find the probability that exactly one of the selected balls is green.
-
18M.2.SL.TZ1.S_9a:
Find the probability that an orange weighs between 289 g and 310 g.
-
18N.2.SL.TZ0.S_1a:
Write down the number of students in the group who take art class.
-
18M.2.SL.TZ1.T_2h:
Two flights are chosen at random from those which were slightly delayed.
Find the probability that each of these flights travelled at least 5000 km.
-
19M.1.SL.TZ2.T_11b.ii:
Write down .
-
17M.1.SL.TZ2.T_2c:
Find the number of children who play only football.
-
17M.2.SL.TZ1.S_9d:
Given that , find .
-
19M.2.SL.TZ1.S_10a.i:
Find the probability of rolling exactly one red face.
-
16N.1.AHL.TZ0.H_10b:
(i) show that ;
(ii) hence find .
-
18M.2.SL.TZ1.S_9e:
The grocer selects two boxes at random.
Find the probability that the grocer buys more than half the oranges in each box.
-
17N.2.AHL.TZ0.H_2b:
Find .
-
17M.2.AHL.TZ1.H_1b:
Find .
-
20N.2.SL.TZ0.T_2b:
Find the number of students who visited at least two types of main attraction.
-
17M.1.AHL.TZ1.H_10a:
Find the value of .
-
17M.1.AHL.TZ1.H_10b.ii:
By considering the graph of f write down the median of ;
-
19M.2.SL.TZ1.S_10d:
Ted will always have another turn if he expects an increase to his winnings.
Find the least value of for which Ted should end the game instead of having another turn.
-
17M.2.SL.TZ1.S_9a:
Find .
-
19M.2.AHL.TZ2.H_3b:
Calculate the probability that Iqbal passes at least two of the papers he attempts.
-
18N.2.SL.TZ0.T_2c.iii:
Find the probability that this student is taught in Spanish, given that the student studies Biology.
-
19N.1.SL.TZ0.S_2c:
Write down the value of and of .
-
17M.1.SL.TZ1.S_1b:
A girl is selected at random. Find the probability that she takes economics but not history.
-
18M.2.SL.TZ1.T_2b:
Calculate the expected frequency of flights travelling at most 500 km and arriving slightly delayed.
-
18M.1.SL.TZ2.T_9a.iii:
Write down an expression, in set notation, for the shaded region represented by Diagram 3.
-
19M.1.SL.TZ1.S_9d:
It is also known that P( > 2) = .
Find .
-
17N.2.SL.TZ0.S_4c:
Find .
-
19M.1.SL.TZ1.S_9a:
Find P(−1.6 < < 2.4). Write your answer in terms of and .
-
21M.2.SL.TZ1.3c:
Given that a bag is not rejected, find the probability that it has a mass greater than grams.
-
19M.2.SL.TZ2.S_9d:
All flights have two pilots. Find the percentage of flights where both pilots flew more than 30 hours last week.
-
21N.1.SL.TZ0.4b:
Let be the event that “box 1 is chosen” and let be the event that “a red ball is drawn”.
Determine whether events and are independent.
-
18N.2.SL.TZ0.T_2a.i:
Find the number of students in the school that are taught in Spanish.
-
18N.2.SL.TZ0.T_2a.iii:
Find the number of students in the school that study both Biology and Mathematics.
-
19M.2.SL.TZ2.T_1d:
State whether or not H0 should be rejected. Justify your statement.
-
17N.2.SL.TZ0.T_4c:
Copy and complete the tree diagram.
-
18M.2.SL.TZ1.T_2c:
Write down the number of degrees of freedom.
-
17M.1.SL.TZ2.T_2d:
Write down the value of .
-
16N.1.SL.TZ0.T_12a:
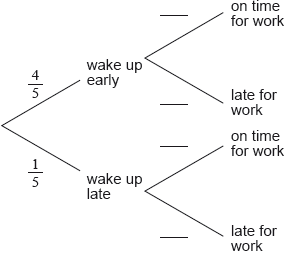
Complete the tree diagram below.
-
19M.1.SL.TZ2.T_5b:
Find the number of surveyed students who did not like any of the three flavours.
-
18M.2.SL.TZ1.T_5d.ii:
A contestant is chosen at random. Find the probability that this contestant fell into a trap.
-
18N.2.SL.TZ0.T_2c.i:
Find the probability that this student studies Mathematics.
-
19M.2.SL.TZ2.T_1e.i:
Find the probability that the student does not take the Spanish class.
-
17M.1.SL.TZ1.T_2b:
Calculate the number of people in Ottawa that speak both English and French.
-
17M.1.SL.TZ1.T_4d:
Write down, in terms of , and , an expression for the set which contains only archery, baseball, kayaking and surfing.
-
16N.2.SL.TZ0.T_2b:
Show that .
-
17M.1.SL.TZ1.T_2a:
Calculate the percentage of the population of Ottawa that speak English but not French.
-
20N.2.SL.TZ0.T_2d.i:
Find the probability that a randomly selected student visited the rollercoasters.
-
20N.1.SL.TZ0.T_14c:
Given that Andre did not become the champion, find the probability that he lost in the semi-final.
-
20N.1.SL.TZ0.T_6b:
Find the probability that the second ball chosen is labelled , given that the first ball chosen was labelled .
-
17M.1.SL.TZ1.T_7b:
Find the probability that Sara’s baggage arrives in London.
-
18M.2.SL.TZ1.T_5d.i:
A contestant is chosen at random. Find the probability that this contestant fell into a trap while attempting to pass through a door in the second wall.
-
20N.2.SL.TZ0.T_2e:
Hence determine whether the events in parts (d)(i) and (d)(ii) are independent. Justify your reasoning.
-
18M.1.SL.TZ2.T_7c:
Two girls are selected at random.
Calculate the probability that one girl answered questions in Mandarin and the other answered questions in Hindi.
-
19M.1.SL.TZ1.T_12b:
Find the probability that at least one of the spins is yellow.
-
17N.2.SL.TZ0.T_4e:
Find the probability that the liquid turns blue.
-
16N.2.SL.TZ0.T_6d:
Show that .
-
20N.1.SL.TZ0.T_14b:
Find the value of .
-
16N.2.SL.TZ0.T_6g:
Find the value of this minimum area.
-
21N.2.SL.TZ0.4a:
Find the probability that there is at least one defective lamp in the sample.
-
21N.2.SL.TZ0.9c.i:
medium.
-
16N.2.SL.TZ0.T_6a:
Write down a formula for , the surface area to be coated.
-
16N.2.SL.TZ0.T_6h:
Find the least number of cans of water-resistant material that will coat the area in part (g).
-
18M.2.SL.TZ1.T_2f:
Write down the probability that this flight arrived on time.
-
19M.2.SL.TZ2.T_1e.ii:
Find the probability that neither of the two students take the Spanish class.
-
18M.2.SL.TZ2.T_1a.i:
Write down the value of a.
-
18M.2.SL.TZ2.T_1b.i:
Use the tree diagram to find the probability that an employee encountered traffic and was late for work.
-
18M.2.SL.TZ2.T_1b.ii:
Use the tree diagram to find the probability that an employee was late for work.
-
18M.2.SL.TZ2.T_1b.iii:
Use the tree diagram to find the probability that an employee encountered traffic given that they were late for work.
-
18M.2.SL.TZ2.T_1e:
Find .
-
16N.2.SL.TZ0.T_2a:
Draw a Venn diagram to represent the given information, using sets labelled , and .
-
16N.2.SL.TZ0.T_2c:
Write down the value of .
-
18N.2.SL.TZ0.T_2c.ii:
Find the probability that this student studies neither Biology nor Mathematics.
-
17N.2.SL.TZ0.T_4b:
Find the probability that both people chosen are not allergic to nuts.
-
17N.2.SL.TZ0.T_4f:
Find the probability that the tested adult is allergic to nuts given that the liquid turned blue.
-
18M.2.SL.TZ1.T_5b:
Find the probability that only one of Ayako and Natsuko falls into a trap while attempting to pass through a door in the first wall.
-
19M.2.SL.TZ2.T_1b:
State the number of degrees of freedom.
-
20N.2.SL.TZ0.T_2a.ii:
Find the value of .